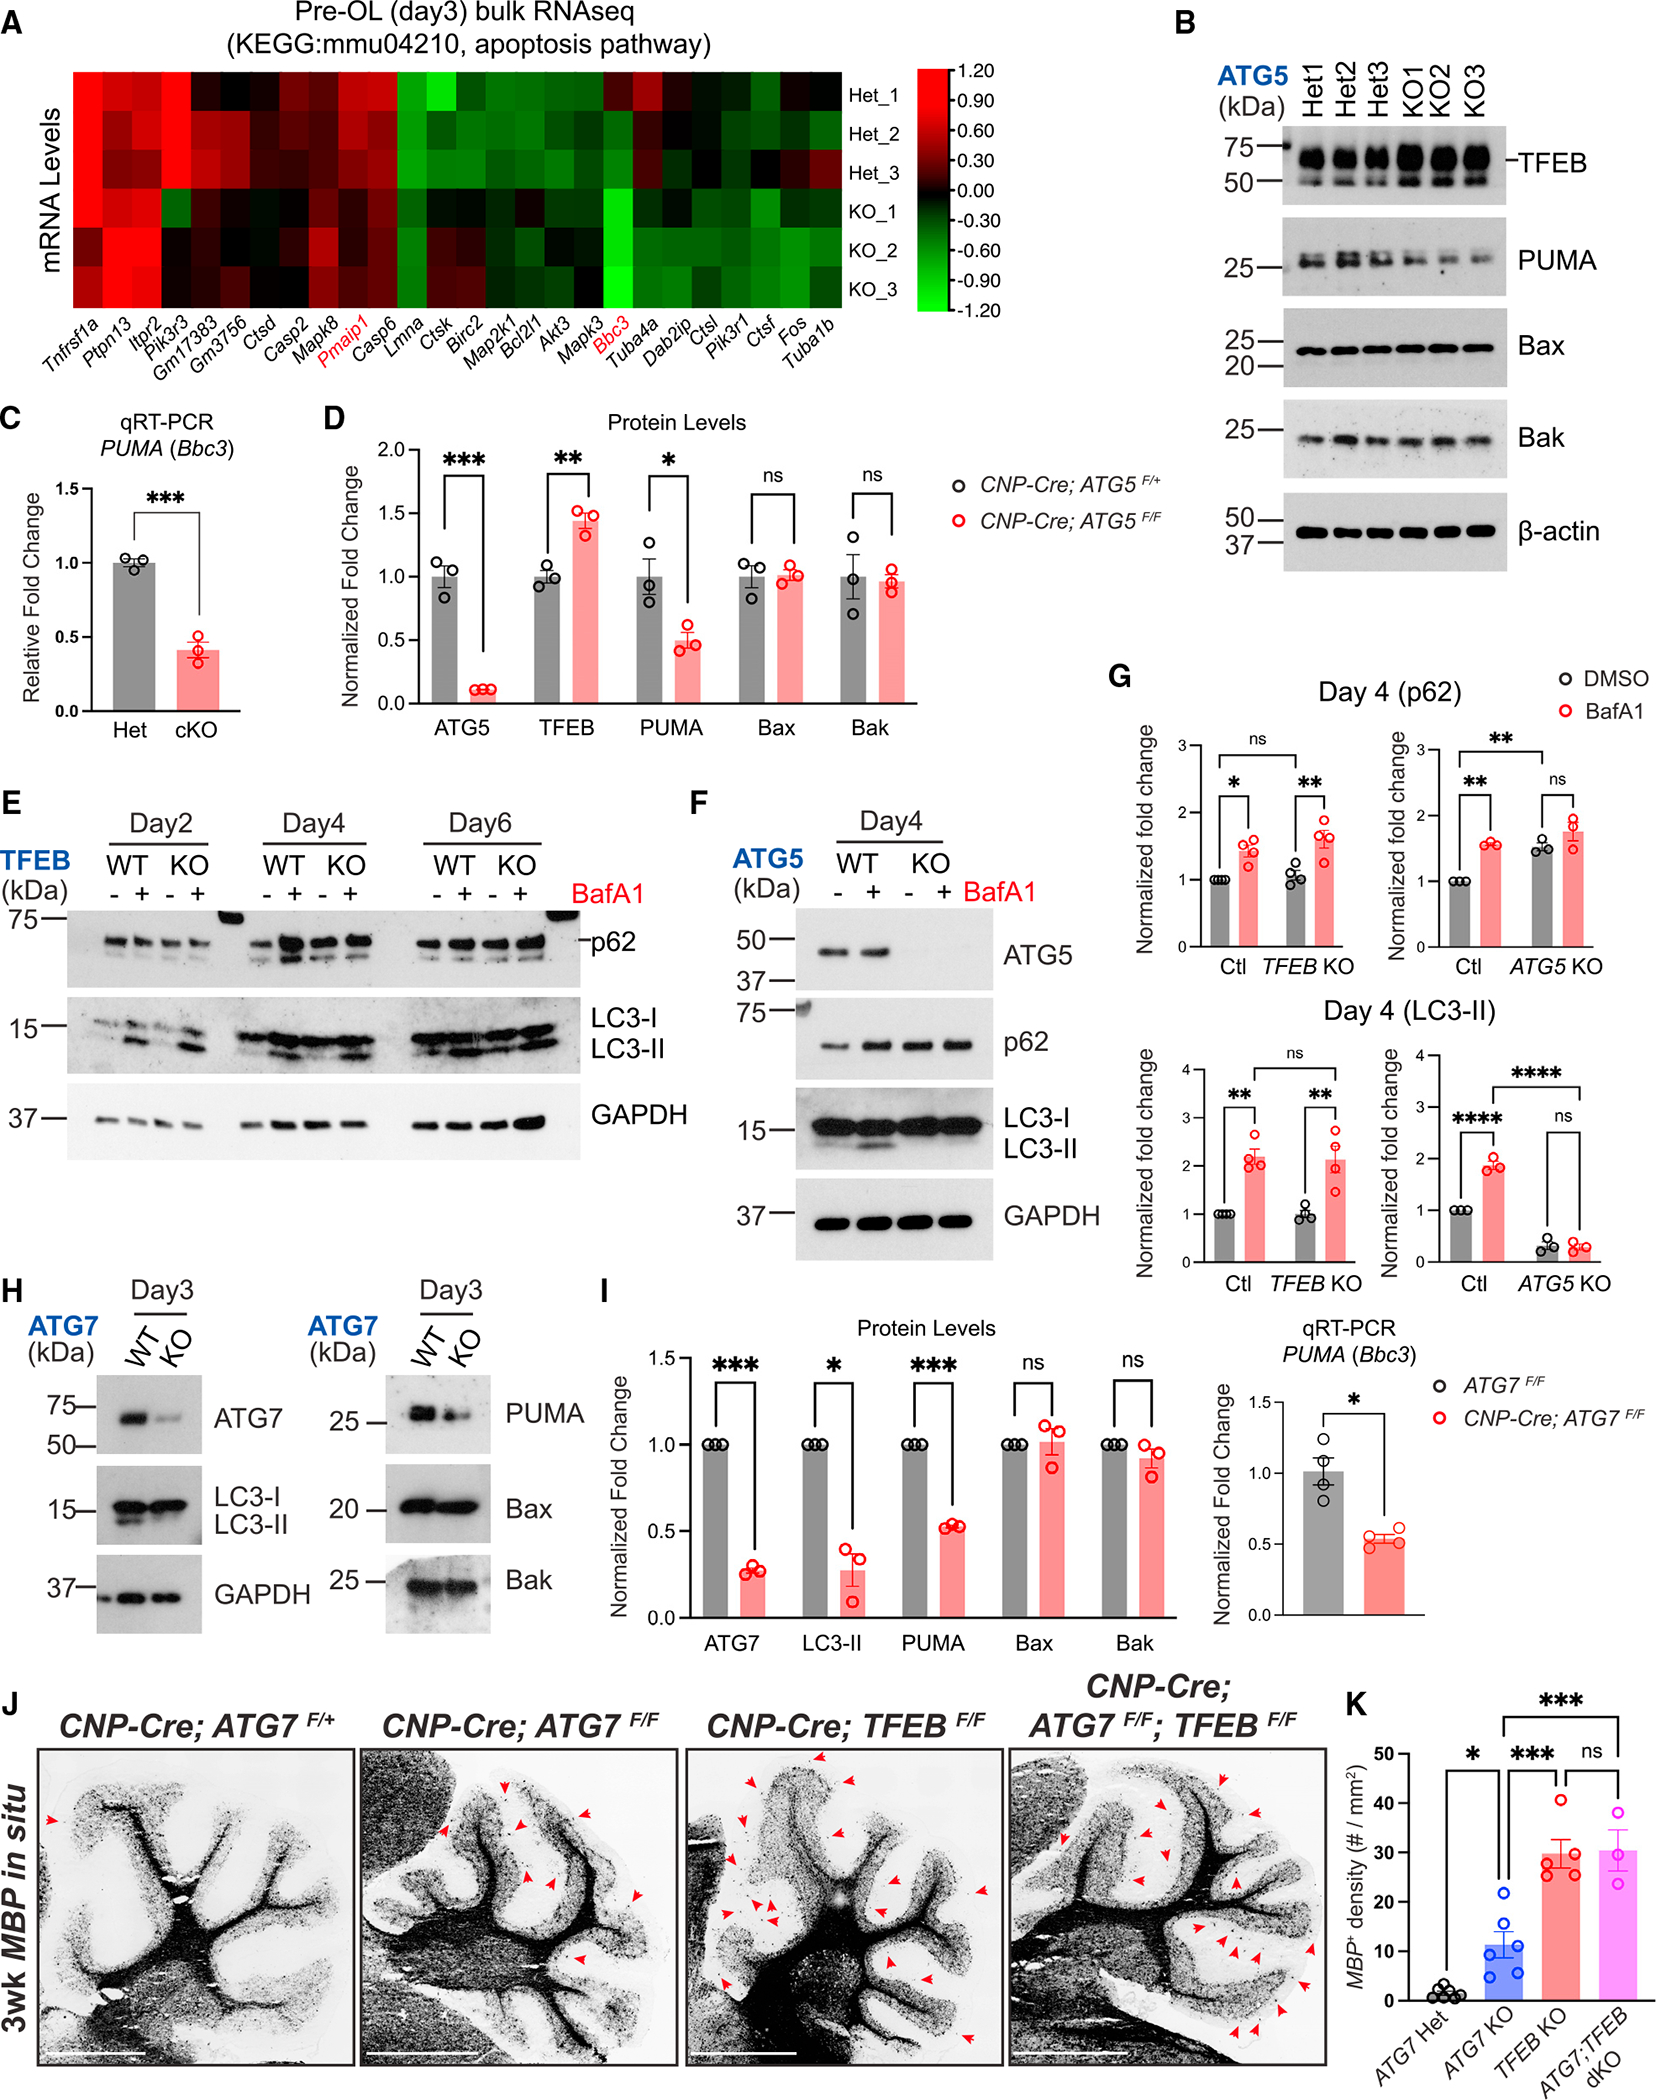
Figure 5. Autophagy genetically interacts with the TFEB pathway to control pre-OL cell fate.

(A) Heatmap showing expression levels (in Z scores) of genes belonging to the KEGG mmu04210: apoptosis pathway that were significantly up- or downregulated (adjusted p value < 0.05) in ATG5 cKO pre-OLs at differentiation day 3 by bulk RNA-seq. Each row represents a biological repeat, and each column represents a gene. The heatmap was generated using the TBtools software.27
(B) Western blot analysis of ATG5 Het and ATG5 cKO pre-OLs at differentiation day 3. The short line indicates the protein band of TFEB.
(C) Quantitative RT-PCR showing PUMA mRNA levels in control and ATG5 cKO pre-OLs.
(D) Quantification of ATG5, TFEB, PUMA, Bax, and Bak protein levels in ATG5 Het and ATG5 cKO pre-OLs at differentiation day 3. n = 3 separate cell purifications.
(E) Biochemical analysis of autophagy flux in TFEB KO OLs with or without BafA1 compared with wild-type (WT) cells under the same conditions. The short line indicates the protein band of p62.
(F) Western blot analysis of p62 and LC3-I/II levels in the presence or absence of BafA1 in ATG5 WT (ATG5F/F) and KO (CNP-Cre; ATG5F/F) pre-OLs.
(G) Quantification of p62 and LC3-II protein levels in OLs at differentiation day 4 (pre-OL stage) in the presence or absence of BafA1. The protein levels were normalized to GAPDH. Two-way ANOVA followed by Sidak’s multiple comparisons test. n = 4 separate cell purifications for TFEB control and KO. n = 3 separate cell purifications for ATG5 control and KO.
(H) Western blot analysis of LC3-II, PUMA, Bax, and Bak protein levels in ATG7 WT and ATG7 cKO pre-OLs.
(I) Quantification of ATG7, LC3-II, PUMA, Bax, and Bak protein levels as well as PUMA mRNA levels in ATG7 WT and ATG7 cKO pre-OLs at differentiation day 3. n = 3 separate cell purifications for western blot analysis. n = 4 separate cell purifications for qRT-PCR analysis.
(J) Representative micrographs from 3-week-old control and mutant cerebella labeled by MBP in situ probes. Red arrows indicate ectopic OLs in the cerebellar ML.
(K) Quantification of MBP+ OL density in the cerebellar ML. Open circles represent individual animals; n ≥ 3 animals per category.
Error bars represent SEM. Scale bars: 1 mm in (J). Two-tailed t tests for (C), (D), and (I). *p < 0.05, **p < 0.01, ***p < 0.001, ****p < 0.0001, ns, not significant.
