
Figure 1.
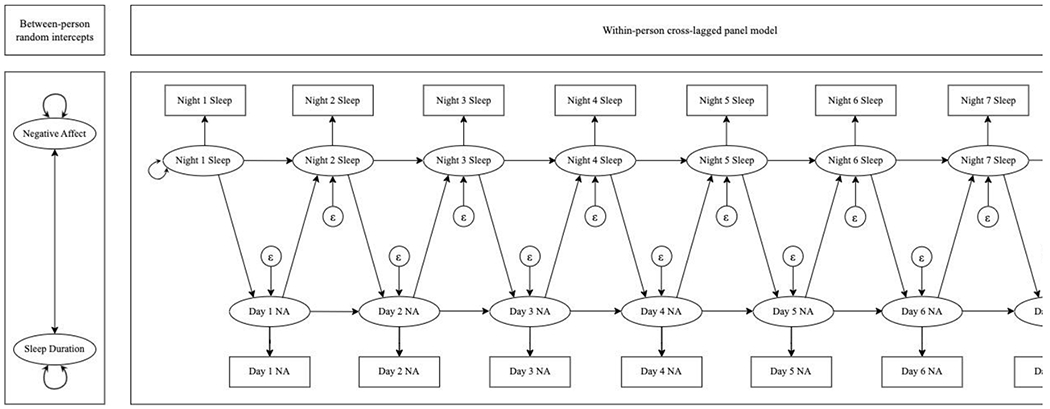
Path diagram of random intercept cross-lagged panel model used in this study. The between-person panel (left) depicts variables that reflect trait-like components of sleep duration and negative affect. The two-headed arrow between these variables demonstrates that the correlation between these variables was estimated. The two-headed arrows next to negative affect and sleep duration demonstrate that these variables had estimated variances. The within-person panel (right) depicts modeled relationships between state-like sleep duration and negative affect assessed daily. The two-headed arrow next to Night 1 Sleep demonstrates that the variance of night 1 sleep duration was estimated. Epsilons with arrows directed at subsequent sleep and negative affect assessments demonstrate that these variables each had estimated residual variances. One-headed arrows reflect autoregressive relationships between sleep duration, subsequent sleep duration, and negative affect and subsequent negative affect, as well as cross-lagged relationships between sleep duration and subsequent negative affect and negative affect and subsequent sleep duration.