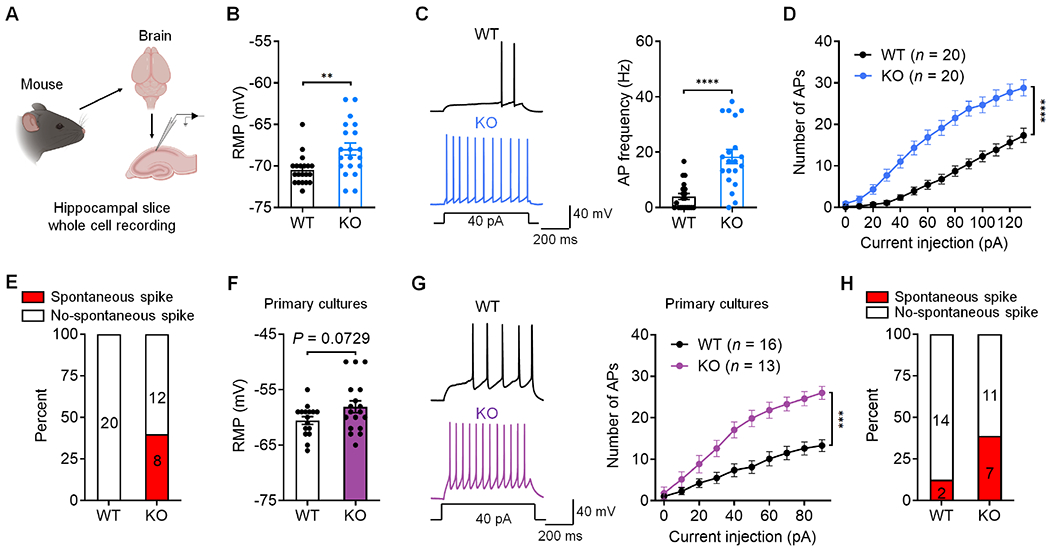
Figure 2. Loss of PD-1 increases neuronal excitability in mouse hippocampal neurons.

(A) Schematic of experimental design for whole-cell patch clamp recordings in mouse brain slices.
(B) RMP recorded from WT and PD-1 KO CA1 neurons.
(C) Representative AP traces (left) and frequency (right) in WT and PD-1 KO CA1 neurons.
(D) Number of APs evoked by step current injection in WT and KO neurons.
(E) Spontaneous discharges in CA1 neurons of PD-1 KO (8/20) but not in WT neurons (0/20).
(F) RMP recorded from WT and PD-1 KO neurons.
(G) Representative AP traces (left) and AP number (right) evoked by step current injection in WT and PD-1 KO neurons from primary cultures.
(H) Percentage of neurons showing spontaneous discharges in WT (2/16) and PD-1 KO (7/18) neurons from primary cultures.
Data are represented as mean ± SEM. Also see Figure S3. Sample size and statistical tests are reported in detail in Tables S1 and S5.
