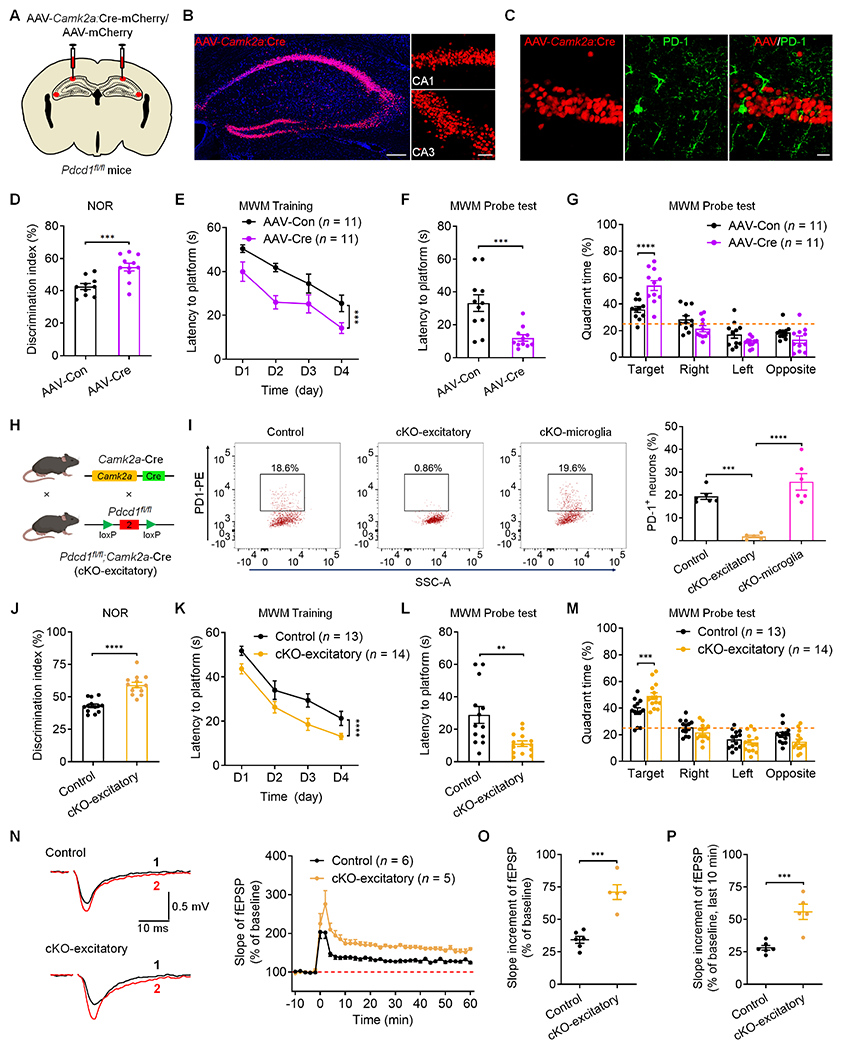
Figure 4. Selective deletion of PD-1 in hippocampal excitatory neurons enhances memory and LTP.

(A) Illustration of bilateral virus (AAV-Camk2a:Cre or AAV-control) injections into the hippocampus of Pdcd1fl/fl mice for selective deletion of Pdcd1 in hippocampal excitatory neurons.
(B) Representative confocal images of the mouse hippocampus show the AAV-infected neurons in the CA1 and CA3 regions. Blue: DAPI staining. Scale bar, 200 μm. Right, higher magnification images showing the infected CA1 and CA3 excitatory neurons. Scale bar, 50 μm.
(C) Representative confocal images showing selective loss of PD-1 in CA1 excitatory neurons labeled with AAV-Camk2a:Cre. Scale bar, 20 μm.
(D) Discrimination index of Pdcd1fl/fl mice injected with AAV-control and AAV-Camk2a:Cre in NOR testing.
(E) Spatial learning curves during MWM training in Pdcd1fl/fl mice show better performance in mice injected with AAV-Camk2a:Cre vs. AAV-control.
(F) MWM probe tests showing latency to platform in Pdcd1fl/fl mice injected with AAV-control and AAV-Camk2a:Cre.
(G) Quadrant percent time of Pdcd1fl/fl mice injected with AAV-control and AAV-Camk2a:Cre in the MWM probe test.
(H) Schematic of conditional deletion of Pdcd1 in excitatory neurons (cKO-excitatory).
(I) Flow cytometry images (left) and quantification (right) showing the percentage of PD-1+ neurons in the hippocampi of control littermates, cKO-excitatory mice, and cKO-microglia mice.
(J) Discrimination index of control littermates and cKO-excitatory mice in NOR testing.
(K) Spatial learning curve during MWM training in control littermates and cKO-excitatory mice.
(L) MWM probe tests for latency to platform in control littermates and cKO-excitatory mice.
(M) Quadrant percent time of control littermates and cKO-excitatory mice in the MWM probe test.
(N) Representative traces (left) and summary plots (right) of LTP induced by 2 × HFS in CA1 region of control littermates and cKO-excitatory slices. Black traces (1) and red trace (2) represent the baseline fEPSP and post-induction fEPSP, respectively.
(O-P) Quantification of average slope of LTP in CA1 region of control littermate and cKO-excitatory slices in entire phase (O) and late phase (P).
Data are represented as mean ± SEM. Also see Figures S4–S7. Sample size and statistical tests are reported in detail in Tables S1 and Table S5.
