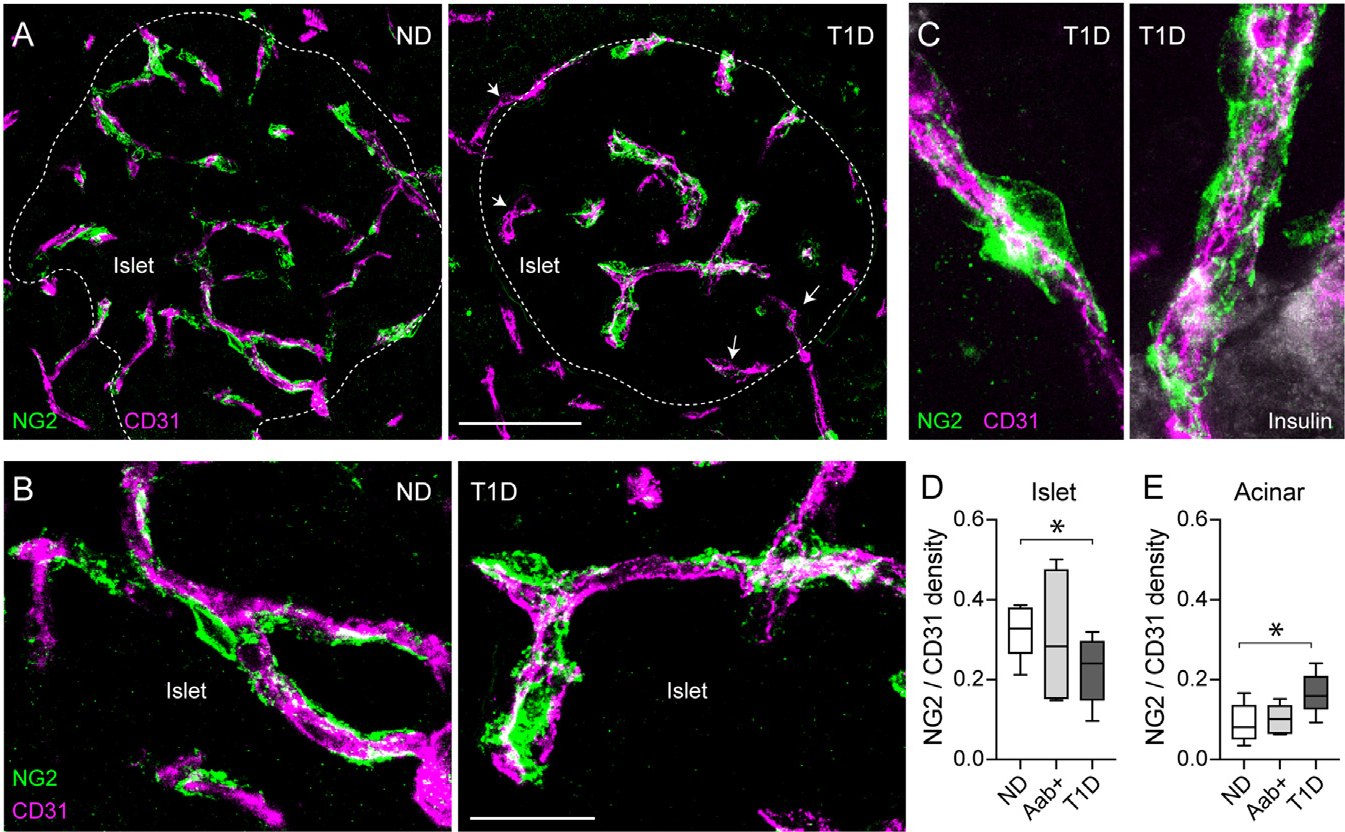
Figure 1. Pericyte coverage of capillaries is decreased in islets from donors with T1D.

(A and B) z stack of confocal images of the vasculature in islets from a non-diabetic (ND; nPOD6531) and a T1D donor (T1D duration: 1.5 years; nPOD6469) immunostained for endothelial cells (CD31; magenta) and pericytes (NG2; green). Dashed lines indicate islet border (related to Figure S2), and arrows indicate T1D capillaries lacking pericytes.
(C) z stack of confocal images of capillaries at the border of islets in a T1D donor.
(D and E) Ratio of pericyte:endothelial cells quantified as NG2 area:CD31 area in islets (D) and acinar tissue (E). n = 9 ND, 7 Aab+, and 8 T1D organ donors. For each donor, around 5–7 islets were imaged, and an average value was calculated. Box and whiskers plots are shown, and whiskers reflect minimum and maximum values. *p < 0.05 (one-way ANOVA followed by Tukey’s multiple comparisons test). Scale bars: 50 μm (A) and 20 μm (B).
