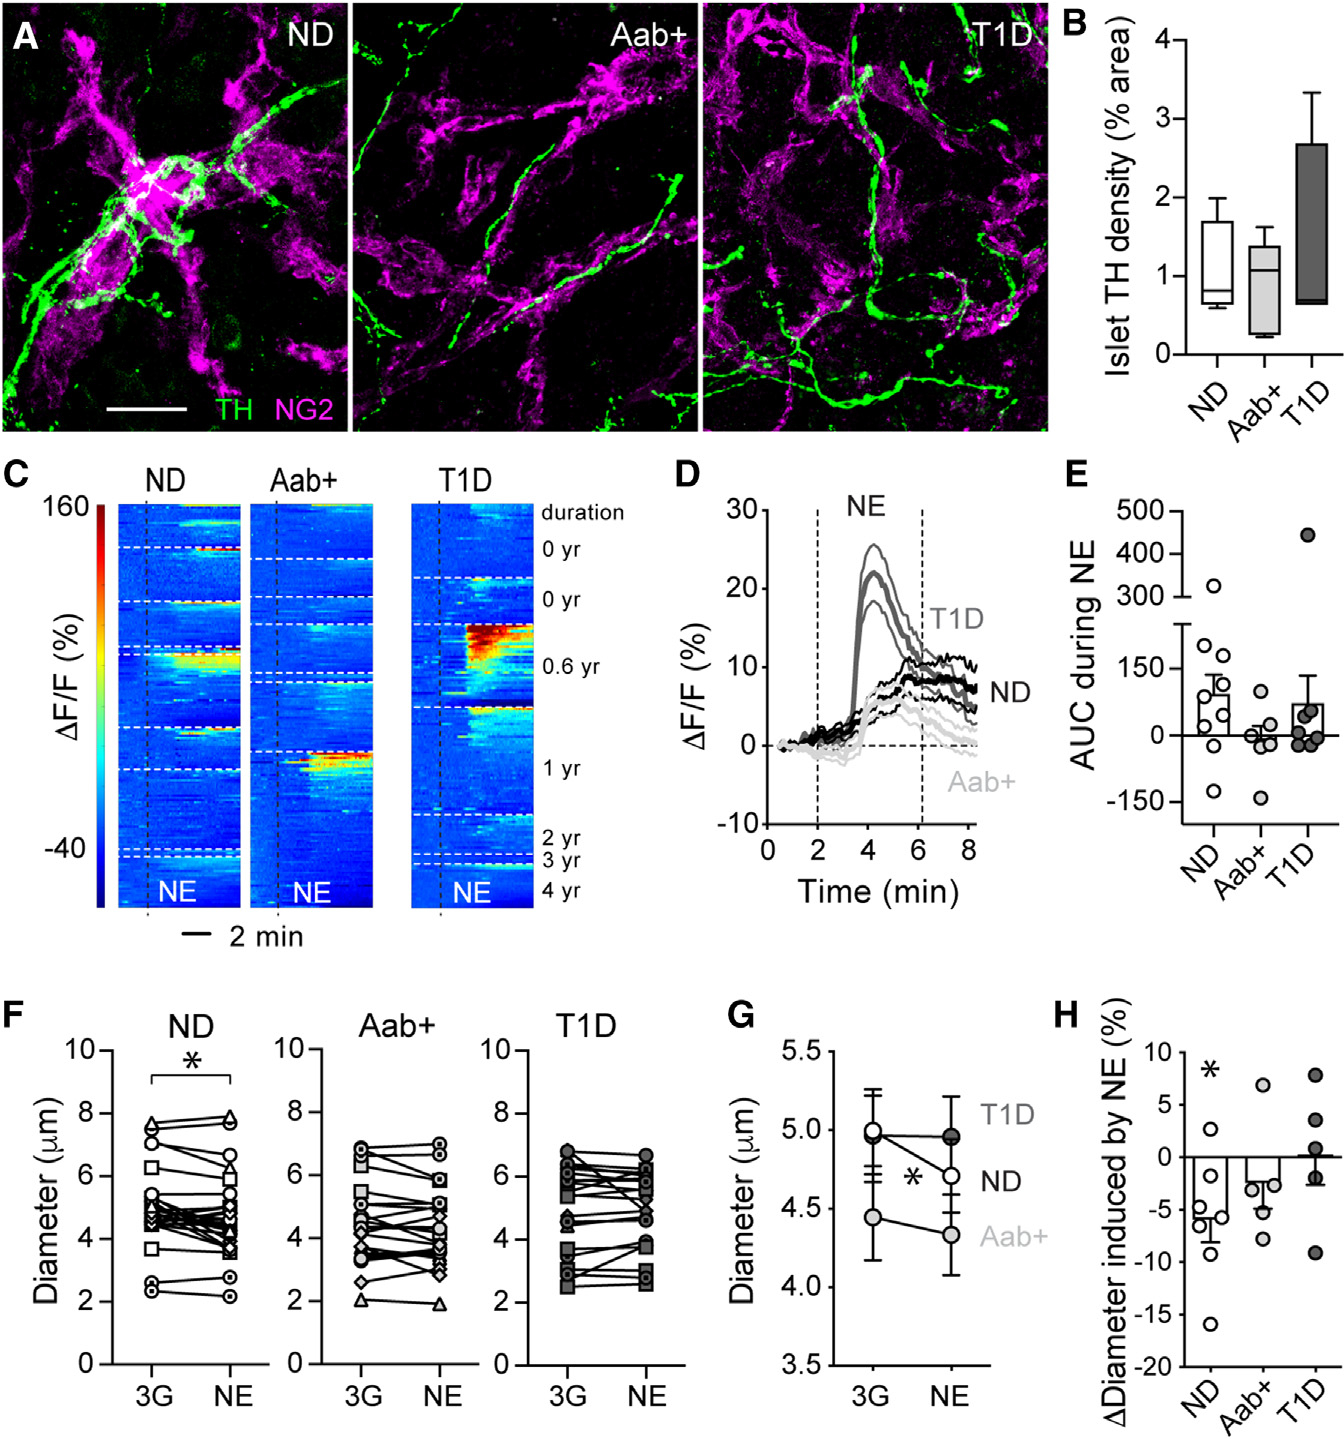
Figure 4. Islet microvascular responses to norepinephrine are impaired in Aab+ and T1D donors.

(A) z stack of confocal images of islets in ND (nPOD6546), Aab+ (nPOD6569), and T1D sections (T1D for 2 years; nPOD6566) immunostained for the sympathetic nerve marker tyrosine hydroxylase (TH; green) and NG2 (magenta). Islets were found using insulin or somatostatin (Figure S5). Scalebar: 20μm.
(B) Percentage of islet area immunostained for TH. n = 4–5 donors per group, 5–7 islets per donor. Box and whiskers plot is shown, and whiskers reflect minimum and maximum values for each dataset.
(C) Heatmaps showing changes in Fluo4 fluorescence (ΔF/F; %) elicited by norepinephrine (NE; 20 μM; in 3G) in islet pericytes from ND (n = 9), Aab+ (n = 7), and T1D donors (n = 7 donors). Each donor is shown separately.
(D) Traces showing changes in Fluo4 fluorescence of all pericytes elicited by NE for each group.
(E) Quantification of the average net AUC of fluorescence traces during stimulation with NE (dots: data point for each donor, bars: mean ± SEM). For each donor, responses from 3–73 cells were recorded, and an average value was calculated.
(F and G) Quantification of changes in islet capillary diameter induced by NE in slices from ND (n = 29 capillaries/7 donors), Aab+ (n = 23 capillaries/5 donors), and T1D donors (n = 22 capillaries/5 donors). Mean ± SEM diameter are shown in (G). *p < 0.05 (paired t test comparing3G with NE for all).
(H) Relative changes in capillary diameter (Δdiameter; % baseline) induced by NE for each group (dots: data point for each donor, bars: mean ± SEM). For each donor, responses from 3–8 vessels were recorded, and an average value was calculated. *p < 0.05 (one-sample t test, theoretical mean = 0).
