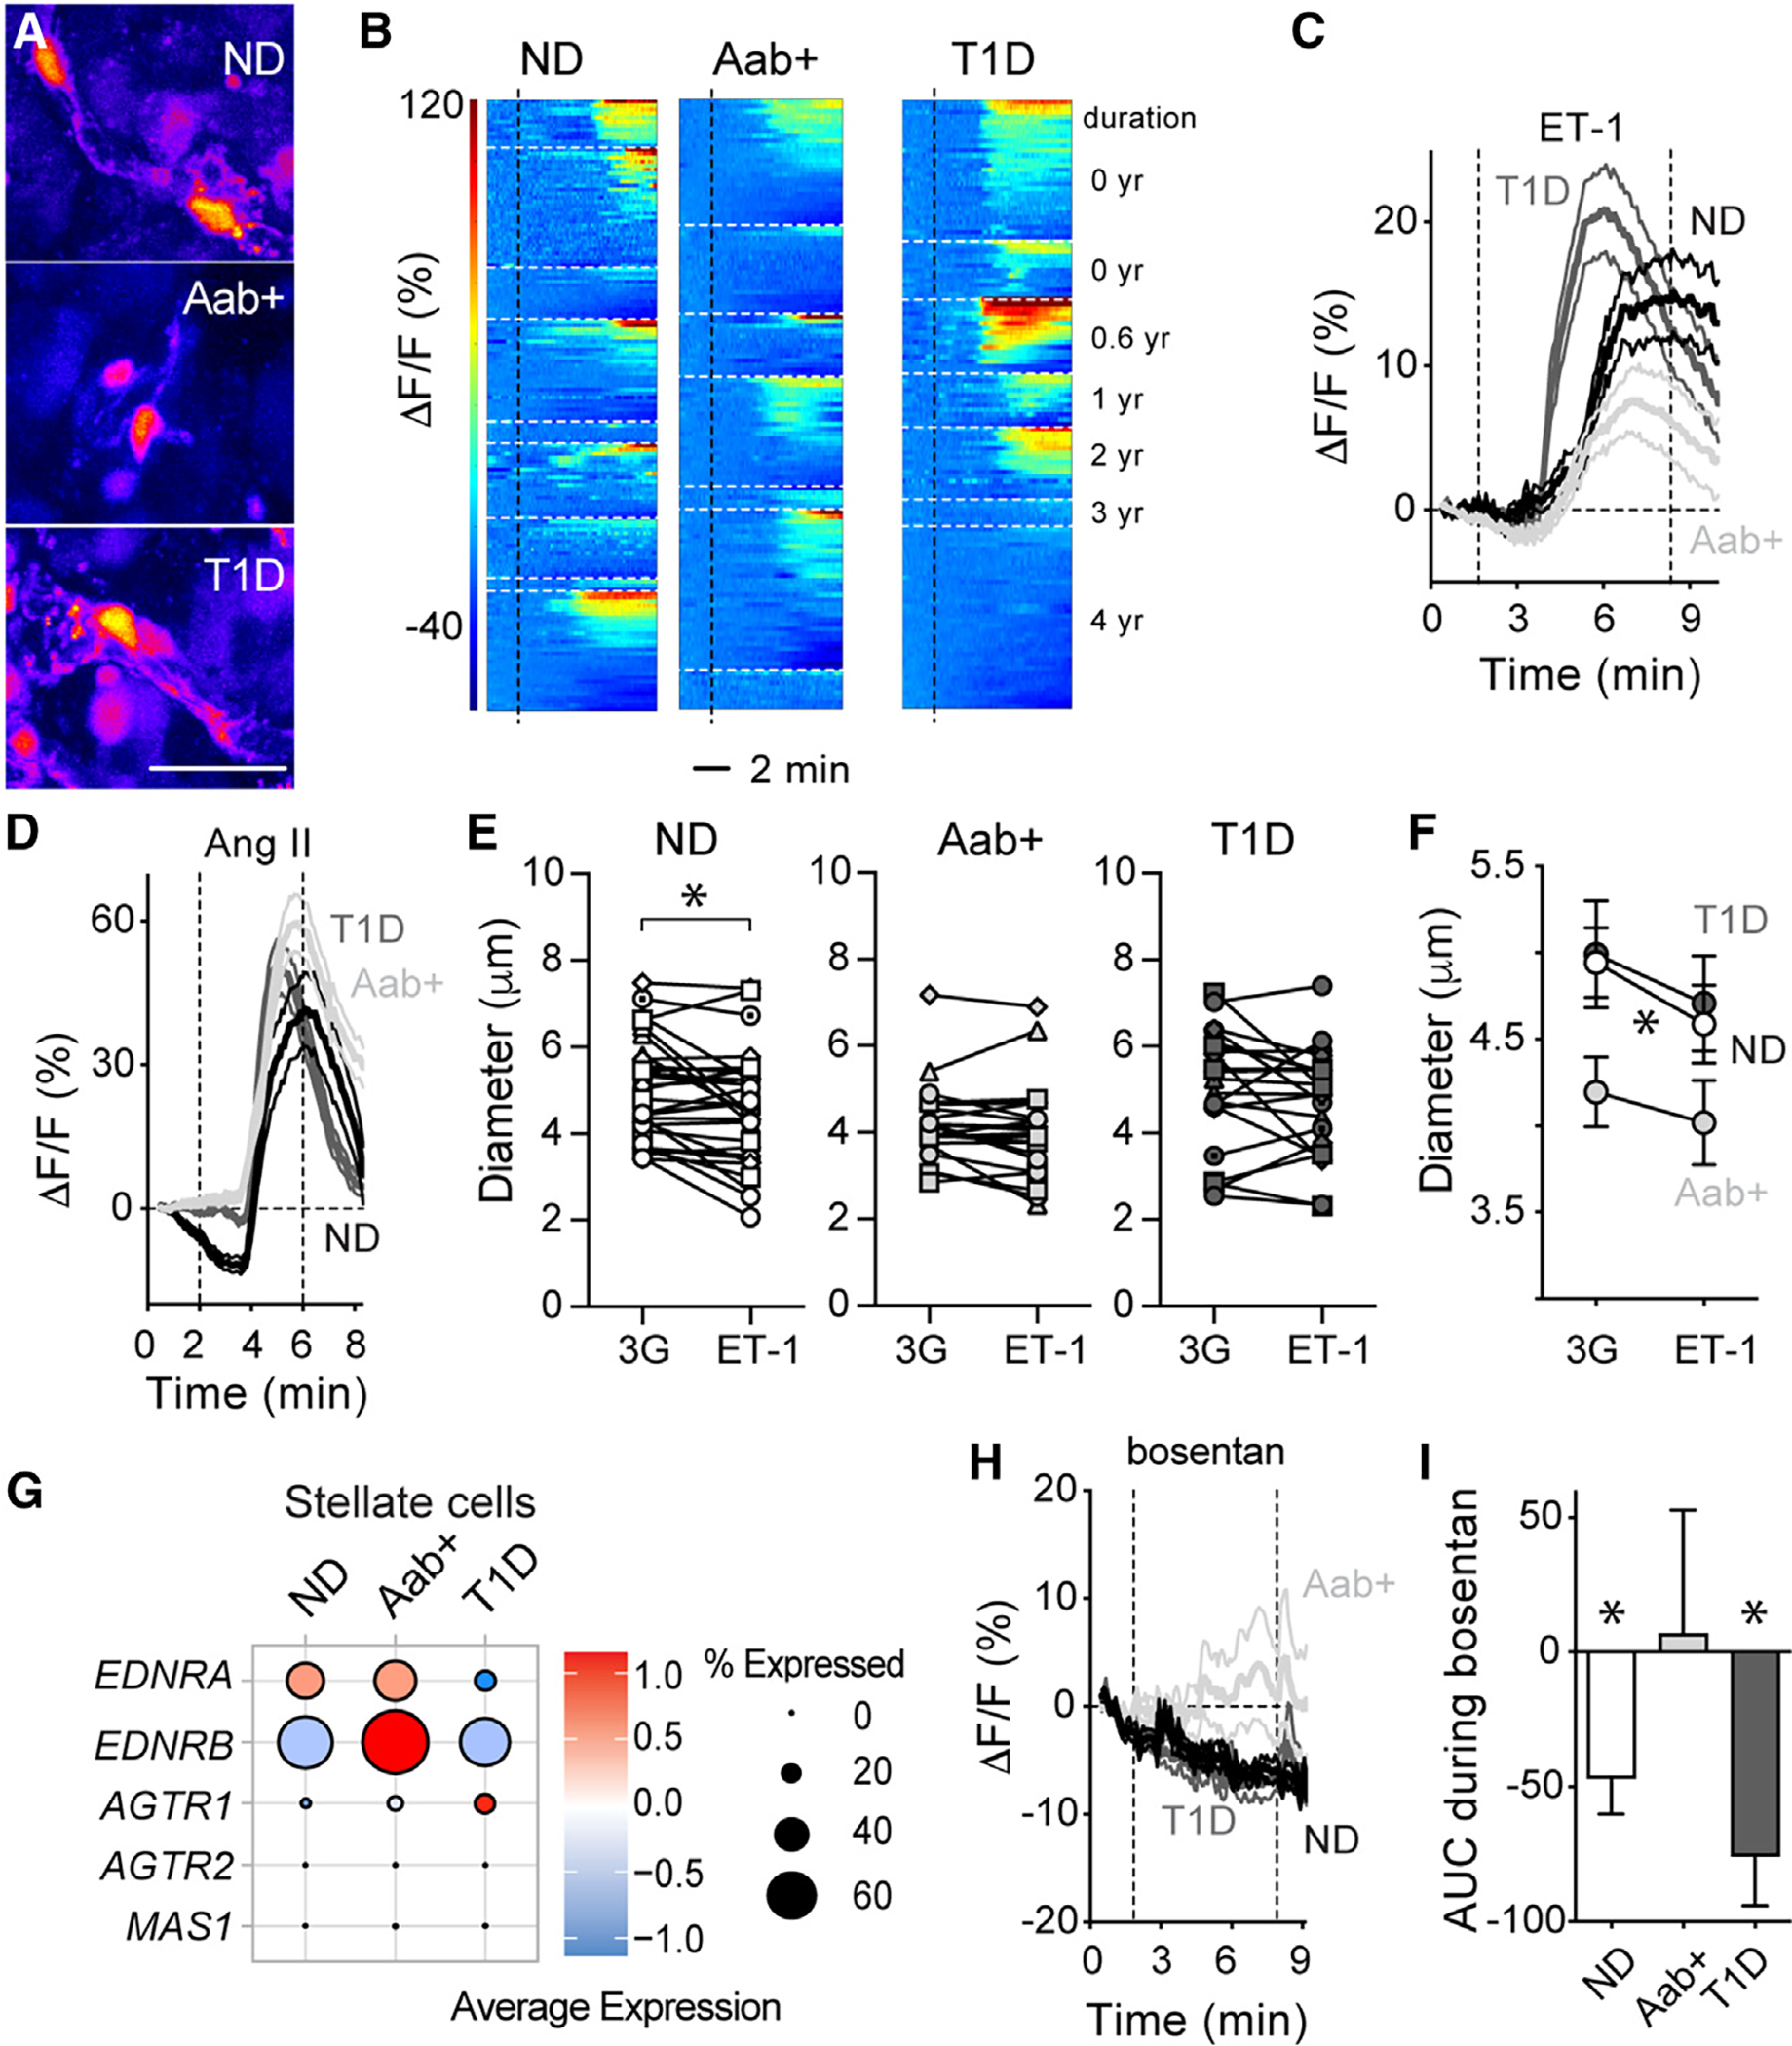
Figure 5. Altered endothelin-1 vascular effects and receptor expression in Aab+ and T1D islets.

(A) Pericytes in islets from an ND (nPOD6516),Aab+ (nPOD6578), and T1D donor (T1D for 0.6 years; nPOD6551) responding to endothelin-1 (ET-1; 10 nM; in 3G) shown in pseudo-color scale. Scale: 20 μm.
(B) Heatmaps showing changes in Fluo4 fluorescence (ΔF/F; %) elicited by ET-1 in islet pericytes in ND (n = 9), Aab+ (n = 7), and T1D donors (n = 7), organized by donor.
(C) Traces showing changes in Fluo4 fluorescence(ΔF/F; %) of all islet pericytes elicited by ET-1. Mean ± SEM values are shown (for ND, n = 166 pericytes/9 donors; for Aab+, n = 125 pericytes/7 donors; for T1D, n = 116 pericytes/7 donors).
(D) Traces showing changes in Fluo4 fluorescence of islet pericytes elicited by angiotensin II (Ang II; 100 nM; for ND, n = 91 pericytes/3 donors; for Aab+, n = 138 pericytes/5 donors; for T1D, n = 119 pericytes/5 donors).
(E and F) Changes in islet capillary diameter induced by ET-1 for individual vessels in islets from ND (n = 32 capillaries/6 donors), Aab+ (n = 21 capillaries/5 donors), and T1D donors (n = 21 capillaries/5 donors).
(F) Mean ± SEM diameter values, *p < 0.05 (paired t test between 3G and ET-1).
(G) Dot plots showing expression levels of genes encoding ET and Ang II receptors in stellate cells from ND, Aab+, or T1D islets. Data were extracted from HPAP database.
(H) Traces showing changes in Fluo4 fluorescence of islet pericytes elicited by ET receptor antagonist bosentan (100 nM in 3G).
(I) Net AUC of fluorescence traces (mean ± SEM values are shown; ND: n = 25 pericytes/3 donors; Aab+: n = 34 pericytes/3 donors; T1D: n = 56 pericytes/3 donors; *p < 0.05 [one-sample t test, mean = 0]).
