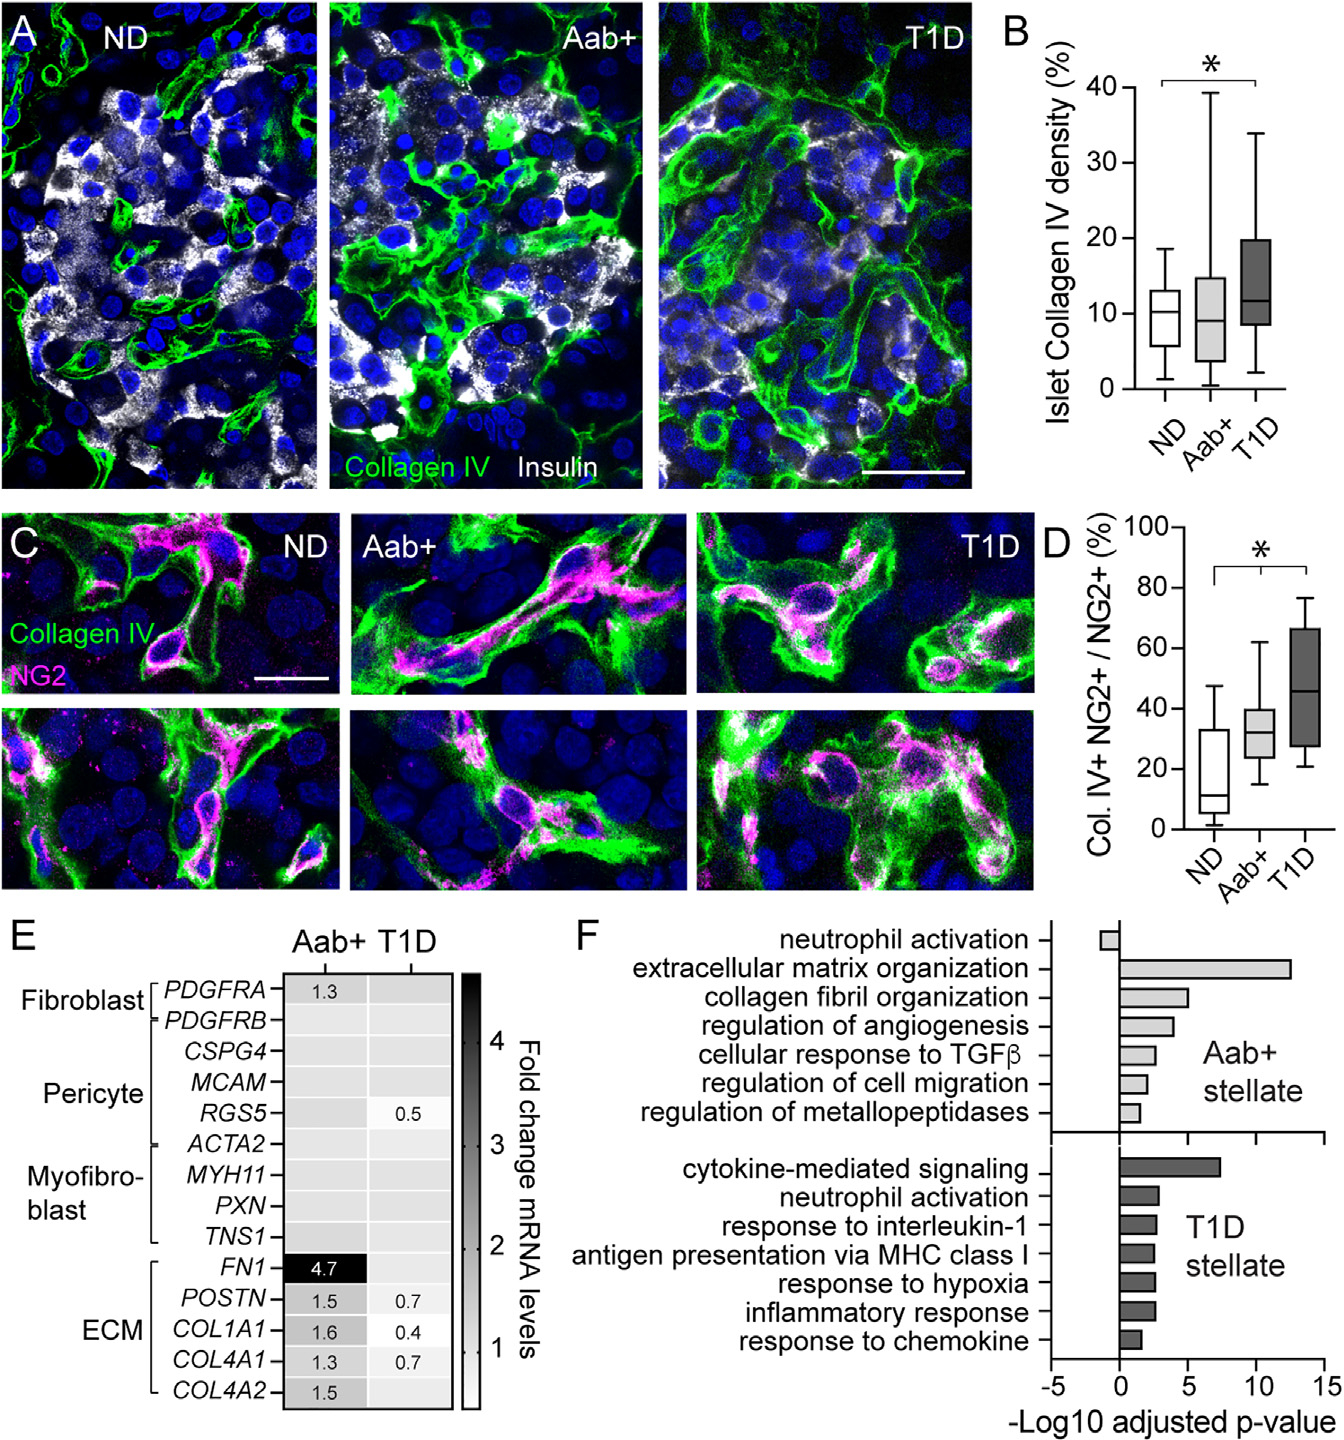
Figure 6. Altered pericyte and stellate cell phenotypes in islets from Aab+ and T1D donors.

(A) Confocal images of islets in ND (nPOD6539),Aab+ (nPOD6573), and T1D donor (nPOD6563) sections immunostained for insulin (gray) and collagen type IV (green).
(B) Percentage of islet area immunostained with collagen IV in each group (n = 28–36 islets/3–5 donors/group; *p < 0.05 [one-way ANOVA followed by Tukey’s multiple comparisons test]). Box and whiskers plot is shown, and whiskers reflect minimum and maximum values for each dataset.
(C) Confocal images pericytes (magenta) embedded in the basement membrane. Colocalization between NG2 and collagen IV appears in white.
(D) Box and whiskers plot showing Mander’s correlation coefficient estimating colocalization between NG2 and collagen IV in confocal images of islets from each group (n = 17–24 islets from 3–5 donors per group; *p < 0.05 [one-way ANOVA followed by Tukey’s multiple comparisons test]).
(E) Changes in expression of pericyte genes (PDGFRB, CSPG4, MCAM, RGS5, ACTA2), fibroblasts/myofibroblast genes (PDGFRA, MYH11, PXN, and TNS1), and genes encoding ECM proteins (FN1, POSTN, COLA1A1, COL4A1, COL4A2) in stellate cell clusters from Aab+ or T1D donors compared with ND donors. Fold change (FC) values compared to levels in ND are indicated when FC >1.2 or <0.8.
(F) Gene Ontology analysis of top 6 biological processes significantly upregulated in stellate cells from Aab+ (light gray) or T1D pancreata (dark gray) compared with ND. Scale bars: 20 μm (A) and 10 mm (C).
