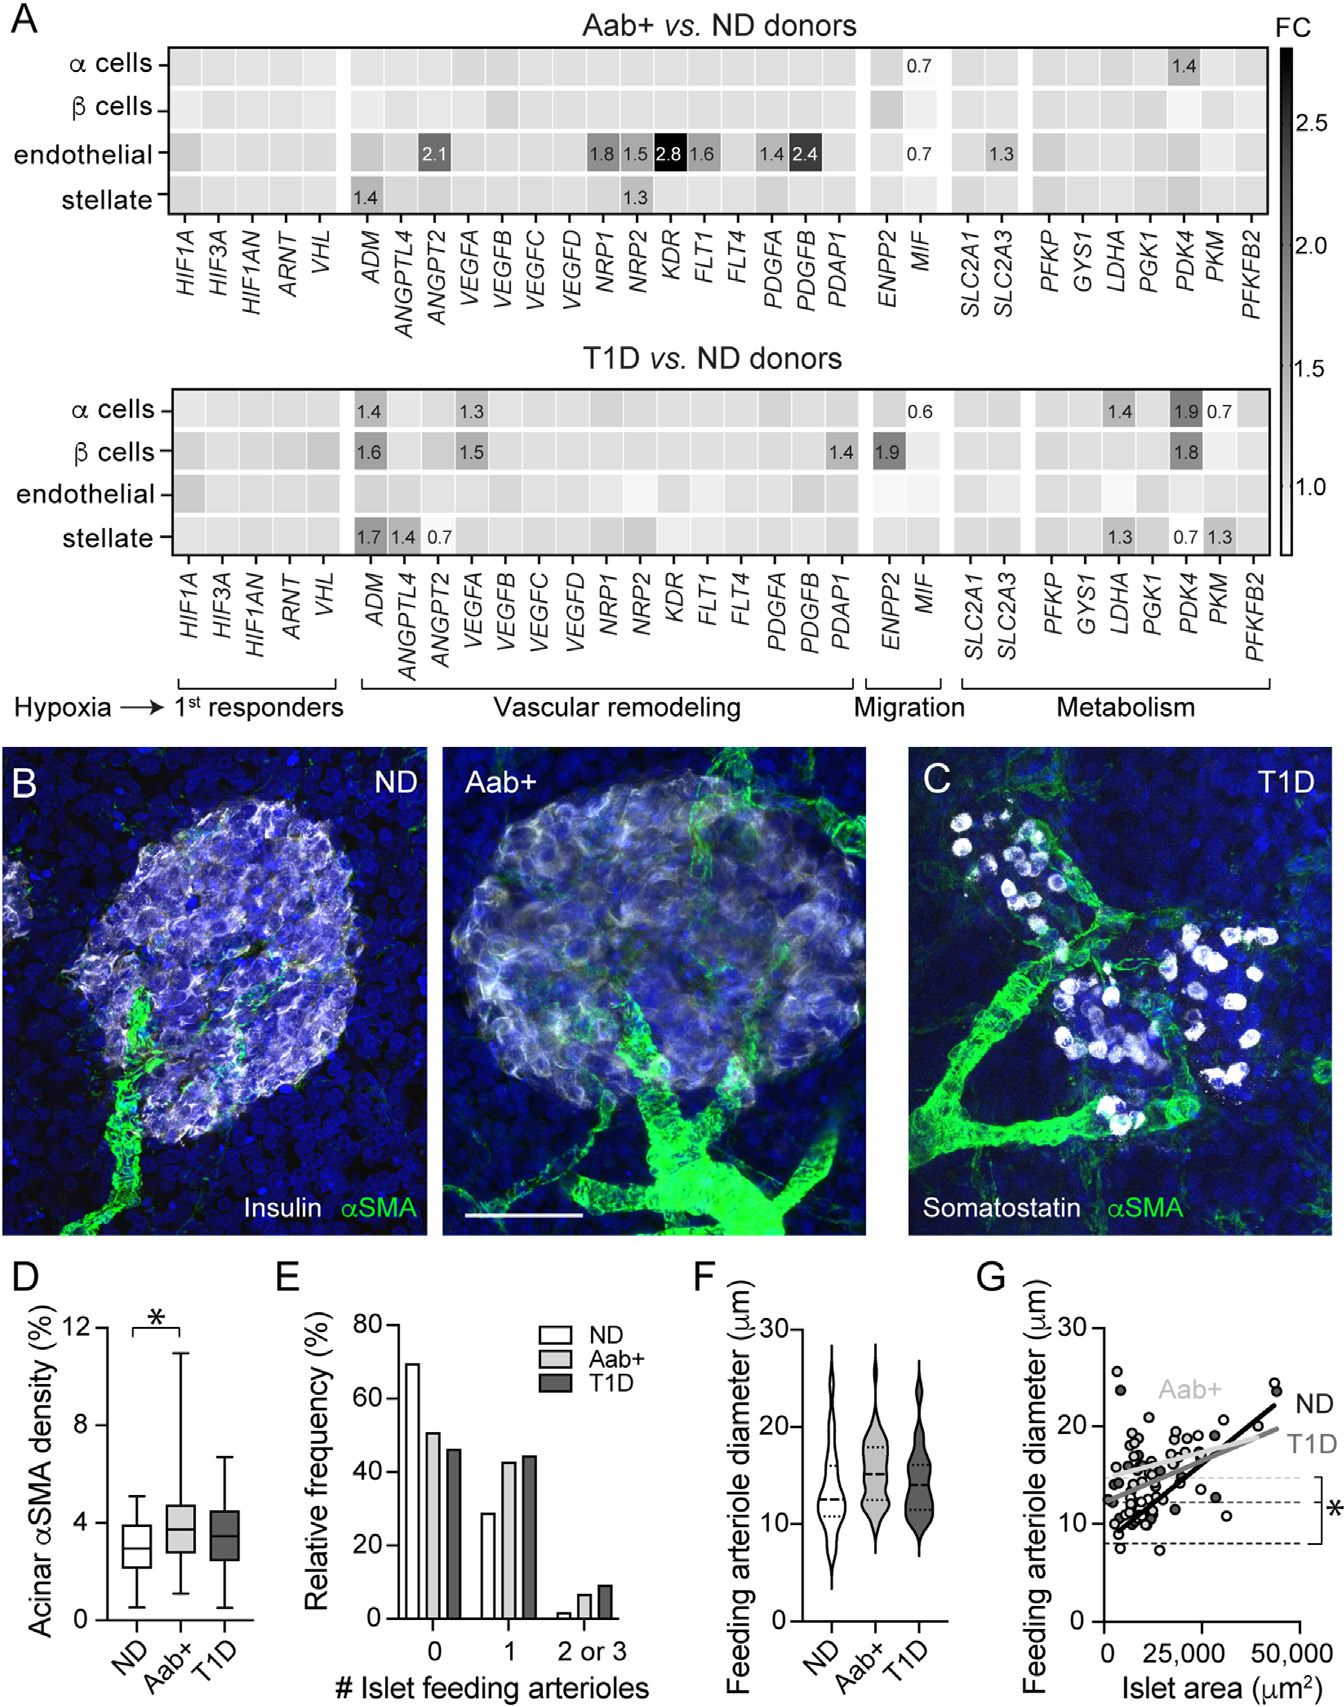
Figure 7. Vascular remodeling occurs in Aab+ and T1D donor pancreata.

(A) Transcriptional alterations in alpha, beta, endothelial, and stellate cells from ND, Aab+, and T1D donor pancreatic islets. Shown are FC values compared to levels in ND of genes involved in hypoxia response (HIF1A, HIF3A, HIF1AN, ARNT, VHL), vasodilation (ADM), angiogenesis and vascular remodeling (ANGPTL4, ANGPT2, VEGFA-D, NRP1–2, KDR, FLT1, FLT4, PDGFA, PDGFB, PDAP1), cell migration (ENPP2, MIF), and metabolism (SLC2A1, SLC2A3, PFKP, GYS1, LDHA, PGK1, PDK4, PKM, PFKFB2).
(B and C) z stack of confocal images of islets in ND (nPOD6539), Aab+ (nPOD6558), and T1D donor sections (T1D for 2.5 years; nPOD6480) immunostained for aSMA (green) and insulin (gray; ND and Aab+; B) or somatostatin (gray; T1D; C). Scale bar: 40 μm.
(D) Box and whiskers plot (whiskers reflect minimum and maximum values) showing percentage of exocrine tissue immunostained with αSMA in slices from each group (n = 39–64 islets/5–7 donors/group; *p < 0.05 [one-way ANOVA followed by Tukey’s multiple comparisons test]).
(E) Histogram showing percentage of islets containing 0, 1, or 2–3 arterioles.
(F) Volcano plot showing feeding arteriole diameter in islets from ND (n = 20 islets/7 donors), Aab+ (n = 40 islets/6 donors), and T1D donors (n = 35 islets/6 donors).
(G) Correlation between islet area and diameter of feeding arteriole. In ND (black) and T1D (dark gray), there is a linear relationship (R2 = 0.61, p = 0.0001 and R2 = 0.2, p = 0.01, respectively), but not in Aab+ (light gray; R2 = 0.05, p = 0.23).
