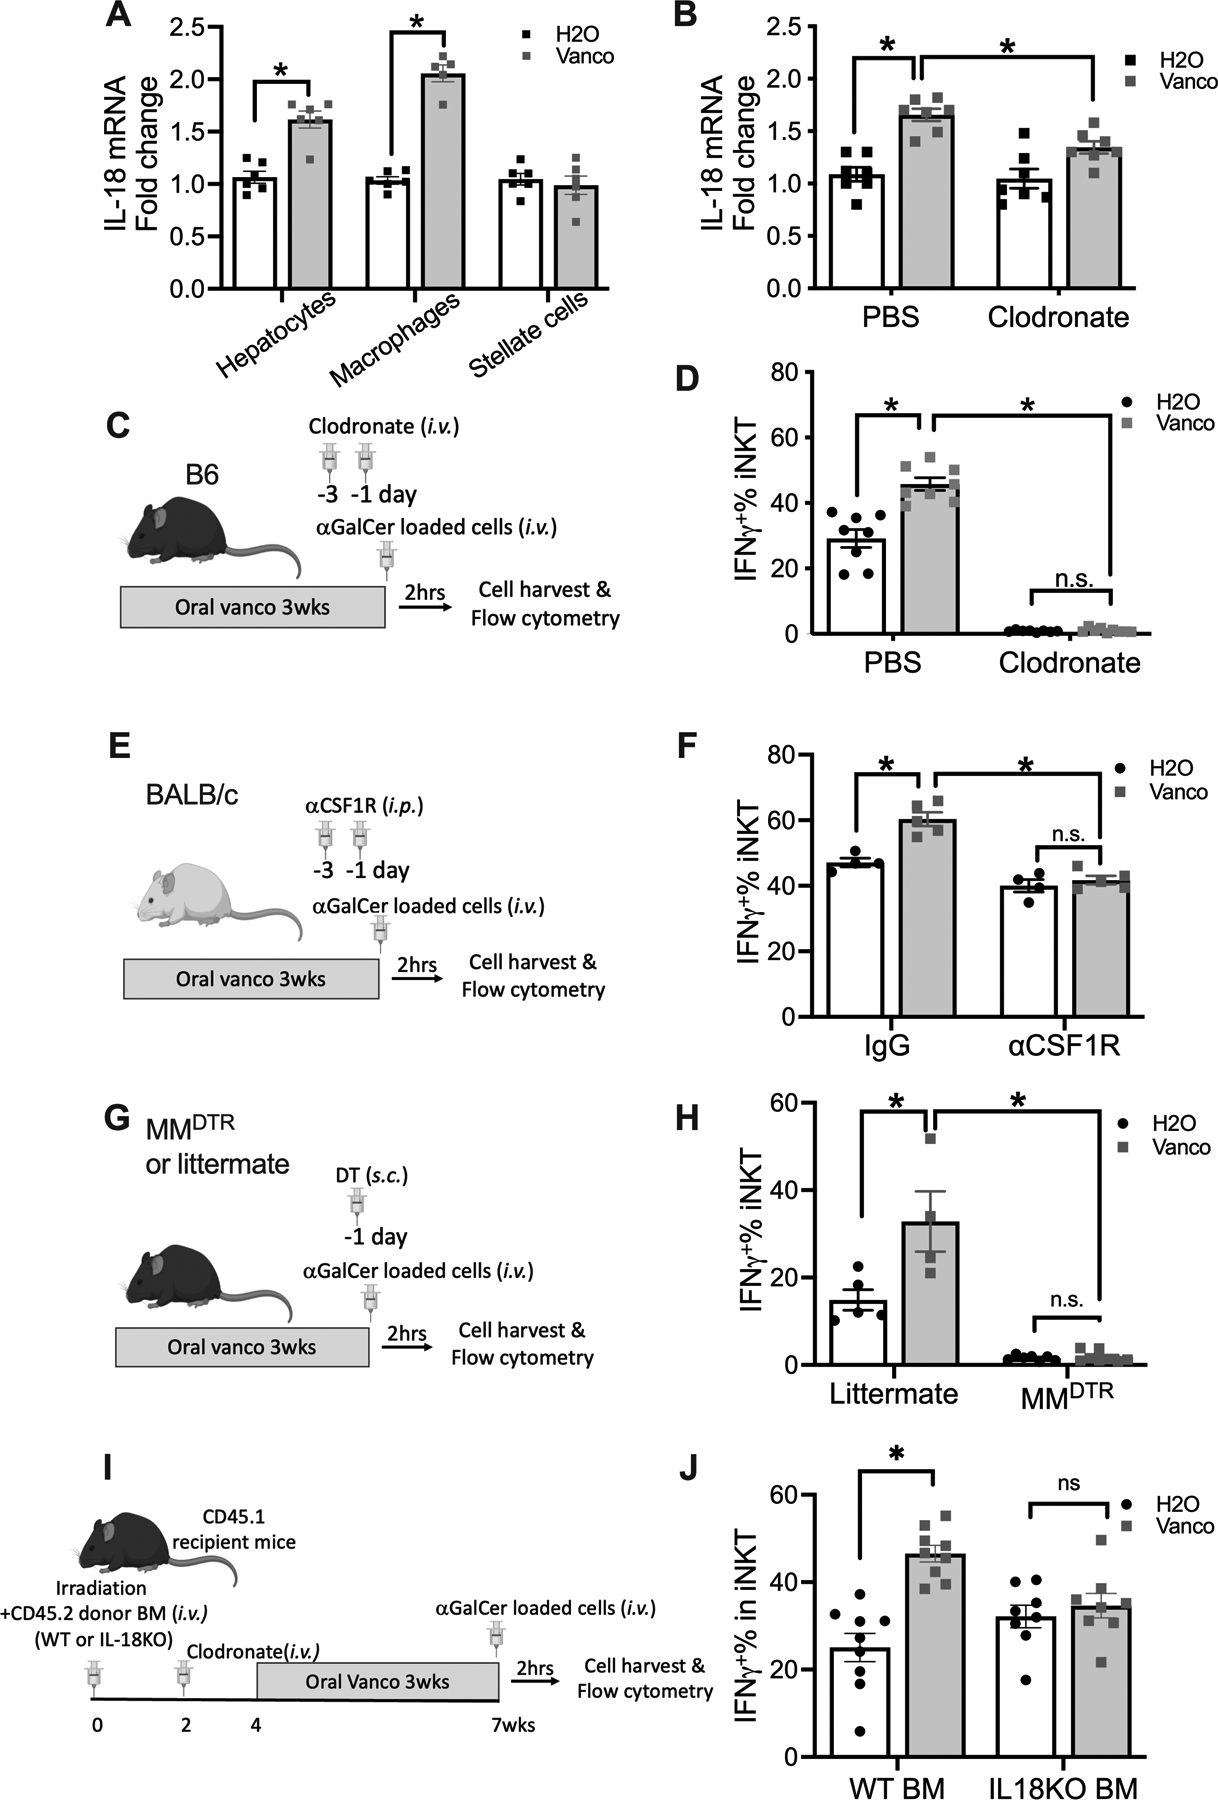
Figure.4. CSF-1R+ macrophages control liver iNKT cell function.

(A) Hepatocytes, macrophages or stellate cells were isolated from C57BL/6 mice kept on vancomycin or H2O. IL-18 mRNA in each cell type was determined by RT-PCR. Results are presented as mean+/− SEM of one experiment. n=5, p<0.05, two-way ANOVA.
(B) Vancomycin or H2O treated C57BL/6 mice were treated with clodronate liposomes to deplete macrophages. One day later, IL-18 mRNA expression in liver tissue was measured by RT-PCR. Results are presented as mean+/− SEM from two independent experiments. n=7, p<0.05, two-way ANOVA.
(C,D) Vancomycin or H2O treated C57BL/6 mice were treated with clodronate liposome to deplete macrophages followed by i.v. injection of αGalCer-loaded EL4 cells plus brefeldin A. (C) Experimental setup. (D) Liver iNKT cell IFNγ+% was measured by flow cytometry. Results are presented as mean+/− SEM from two independent experiments. n=8, p<0.05, two-way ANOVA.
(E,F) BALB/c mice (age 7~10 weeks) were kept on vancomycin or H2O for 3 weeks. Mice received two doses of αCSF-1R or IgG i.p. injections before i.v. injection of αGalCer-loaded A20 cells plus brefeldin A. (E) Experimental setup. (F) Liver iNKT cell IFNγ+% is shown. Results are presented as mean+/− SEM of one experiment, n=4 for IgG H2O and IgG Vanco, n=5 for αCSF-1R H2O and αCSF-1R Vanco, p<0.05, two-way ANOVA.
(G,H) MMDTR mice or littermates (age 7~10 weeks) were kept on vancomycin or H2O for 3 weeks. Then mice were s.c. injected 200 ng diphtheria toxin (DT) to deplete CSF-1R+ macrophage one day before given i.v. injection of αGalCer-loaded EL4 cells with brefeldin A. (G) Experimental setup. (H) Liver iNKT cell IFNγ+% is shown. Results are presented as mean+/− SEM from two independent experiment, n=5 for littermate H2O, 4 for littermate Vanco, 7 for MMDTR H2O, 8 for MMDTR Vanco, p<0.05, two-way ANOVA.
(I, J) CD45.1 recipient mice (age ~6 weeks) were irradiated with 900 rads followed by adoptive transfer of donor bone marrow cells from either CD45.2 WT or IL-18 KO mice, followed by clodronate treatment. Mice were kept on vancomycin or H2O for 3 weeks, and αGalCer-loaded EL4 cells plus brefeldin A was injected i.v.. (G) Experimental setup. (H) Liver iNKT cell IFNγ+% is shown. Results are presented as mean+/− SEM from two independent experiment, n=10, p<0.05, two-way ANOVA.
