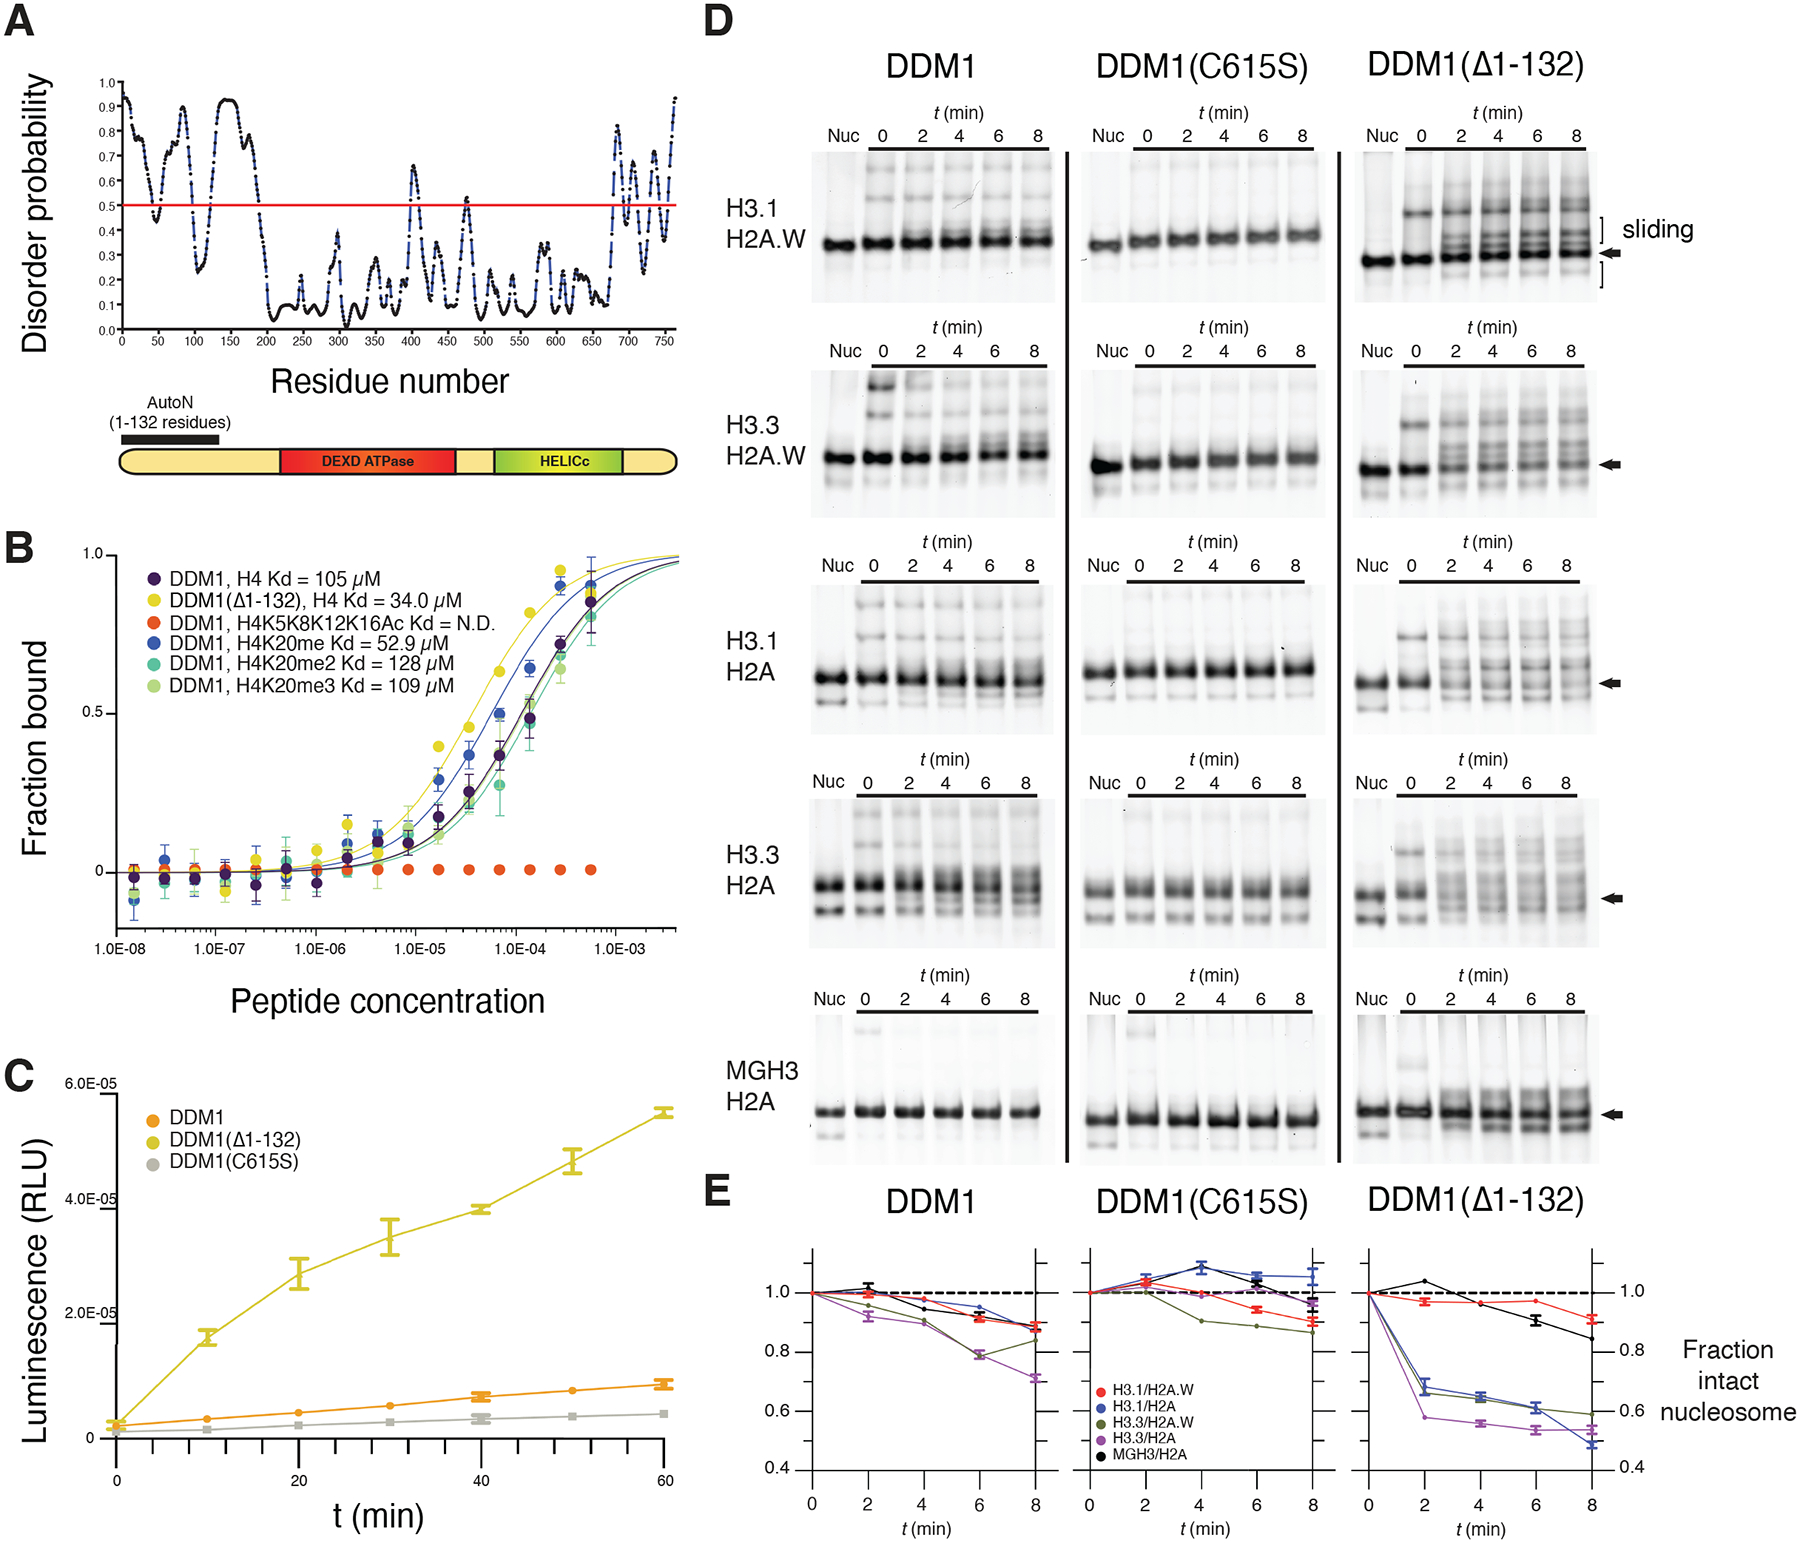
Figure 5. An N-terminal autoinhibitory domain regulates H4 peptide-binding, ATPase and nucleosome remodeling activities of DDM1 with histone variants.

(A) Disorder predictions for DDM1 were calculated with PrDOS95. The red line indicates the threshold corresponding to a false positive rate of 5%. The autoinhibitory domain (1–132 residues) AutoN is indicated in the diagram along with DEXD ATPase and HELICc domains. (B) Binding affinities between DDM1 and H4 peptides shown as the fraction bound at peptide concentrations measured by microscale thermophoresis (MST). KD values were estimated by fitting algorithms provided by the supplier (Methods). Binding was not detected (N.D.) for H4K5K8K12K16Ac (quadruple acetylation), but was detected for unacetylated H4, H4K20me1, H4K20me2, and H4K20me3 peptides. Truncation of AutoN in the DDM1(Δ1–132) enzyme resulted in higher binding affinity consistent with AutoN competing with the H4 tail. (C) DNA-dependent ATPase activities for recombinant DDM1, DDM1(Δ1–132) and DDM1 C615S. ATPase activities are given as luminescence with relative light units (RLU). The X-axis indicates ATPase reaction time. Error bars represent standard deviations from two independent replicates. The relative rate enhancement for ATPase activity between DDM1(Δ1–132) and DDM1 is 6.4x. DDM1C615S has a further reduction of 2.3x relative to DDM1. (D) Nucleosome remodeling assays with 0N60 mono-nucleosomes (147bp Widom 601 DNA plus 60bp linker) were performed with octamers of H2B, H4 and combinations of H3 and H2A variants as shown. Center-positioned nucleosomes (arrows) were incubated with DDM1, DDM1 C615S, or DDM1(Δ1–132) at t=0 mins, and then remodeled upon addition of ATP by putative sliding (slower migration) and unwrapping (faster migration) activities. (E) Quantification of remodeling activities for DDM1, DDM1 C615S and DDM1(Δ1–132) are shown below each assay series as the fraction of intact nucleosomes (arrows) remaining at each timepoint relative to t=0. Error bars indicate standard deviation, and are too small to be resolved for H3.3 H2A.W. DDM1 C615S had little or no remodeling activity and was used as a control.
