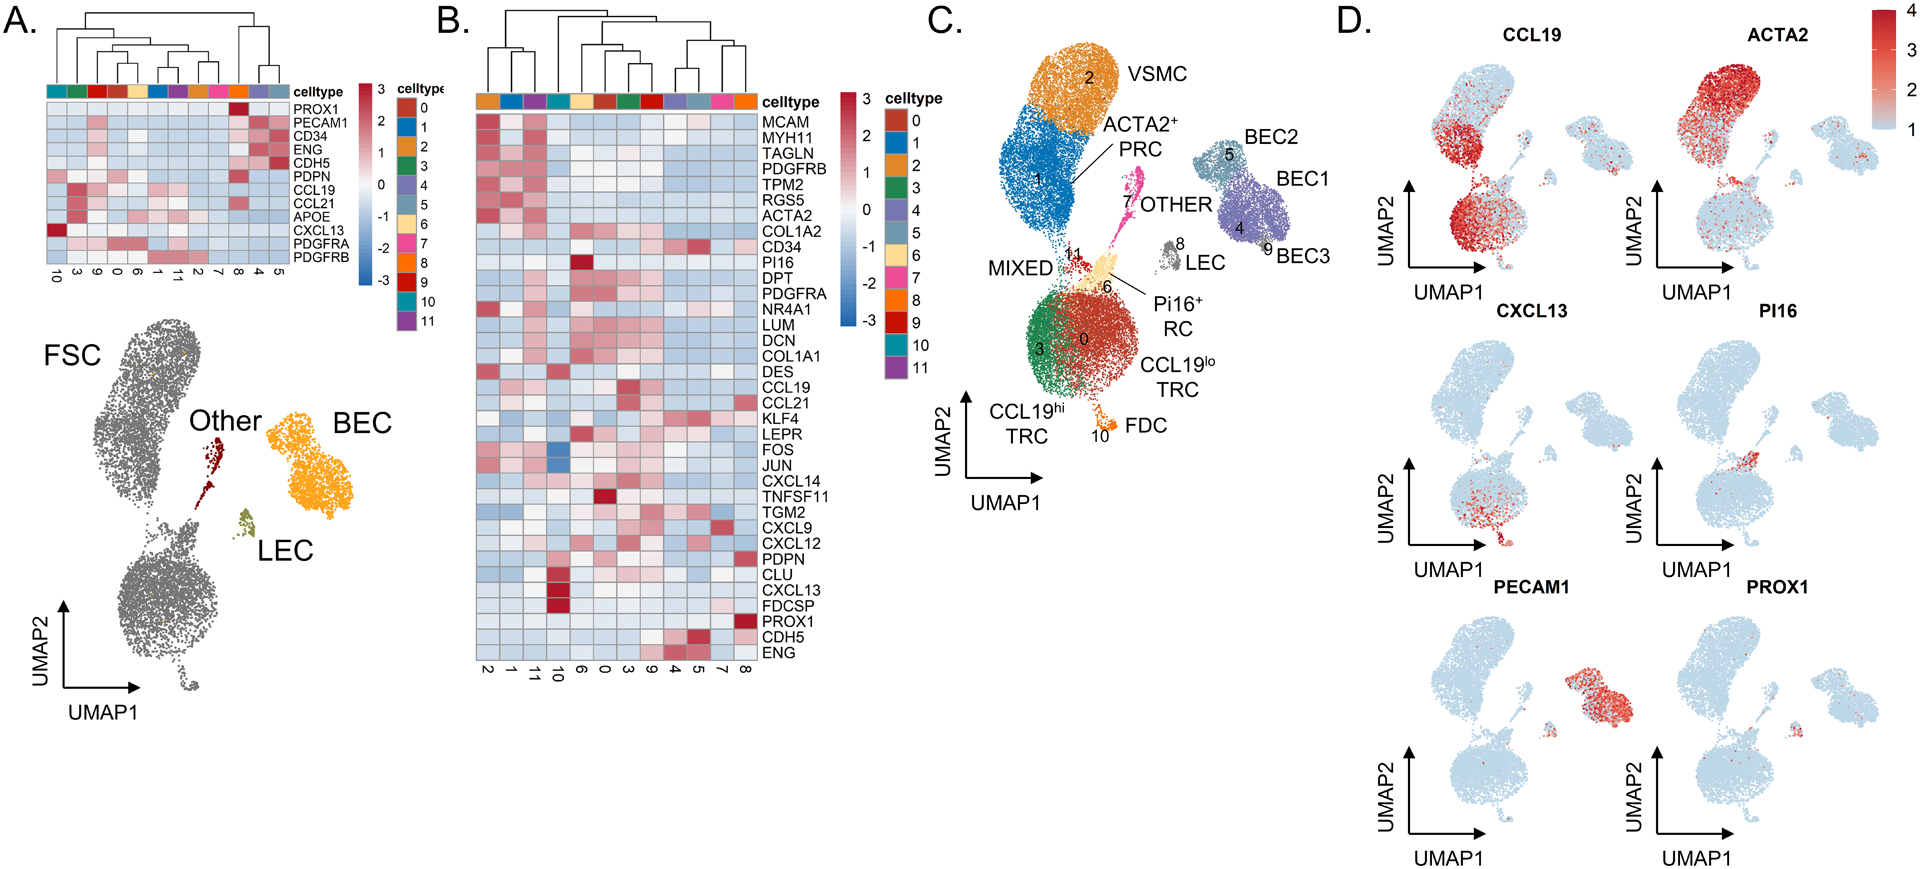
Figure 2. Single-cell RNA sequencing of sorted CD45−EpCAM− cells identifies distinct stromal cell subsets in fresh lymphoid tissue.

(A) Heatmap showing gene expression of known markers for fibroblastic stromal cells (PDGFRA, PDGFRB, CXCL13, APOE, CCL21, CCL19, and PDPN), blood endothelial cells (CDH5, ENG, CD34, PECAM1), and lymphatic endothelial cells (PROX1, PECAM1, PDPN). Underneath, UMAP shows all cells through Seurat-based clustering of sorted CD45−EpCAM− cells acquired from three freshly processed tonsils after filters for quality control and removal of residual hematopoietic and epithelial cells. Cell coloring based on cell type: fibroblastic stromal cells in grey, blood endothelial cells in yellow, lymphatic endothelial cells in green, and other cells in red. (B) Heatmap showing gene expression of known markers for fibroblastic stromal cell subsets, including ACTA2+ perivascular reticular cells (ACTA2, TAGLN, TPM2, PDGFRB), vascular smooth muscle cells (ACTA2, MYH11, MCAM), CCL19hi T-zone fibroblastic reticular cells (CCL19, CCL21, CXCL12, CXCL9), CCL19lo T-zone fibroblastic reticular cells (LUM, DCN, PDPN, PDGFRA), Pi16+ reticular cells (PI16, LEPR), and follicular dendritic cells (CXCL13, CLU, FDCSP, DES). (C) UMAP showing Seurat-based clustering with labeled cell-types based on expression of known markers. (D) Feature plots show relative expression of cluster-defining markers.
