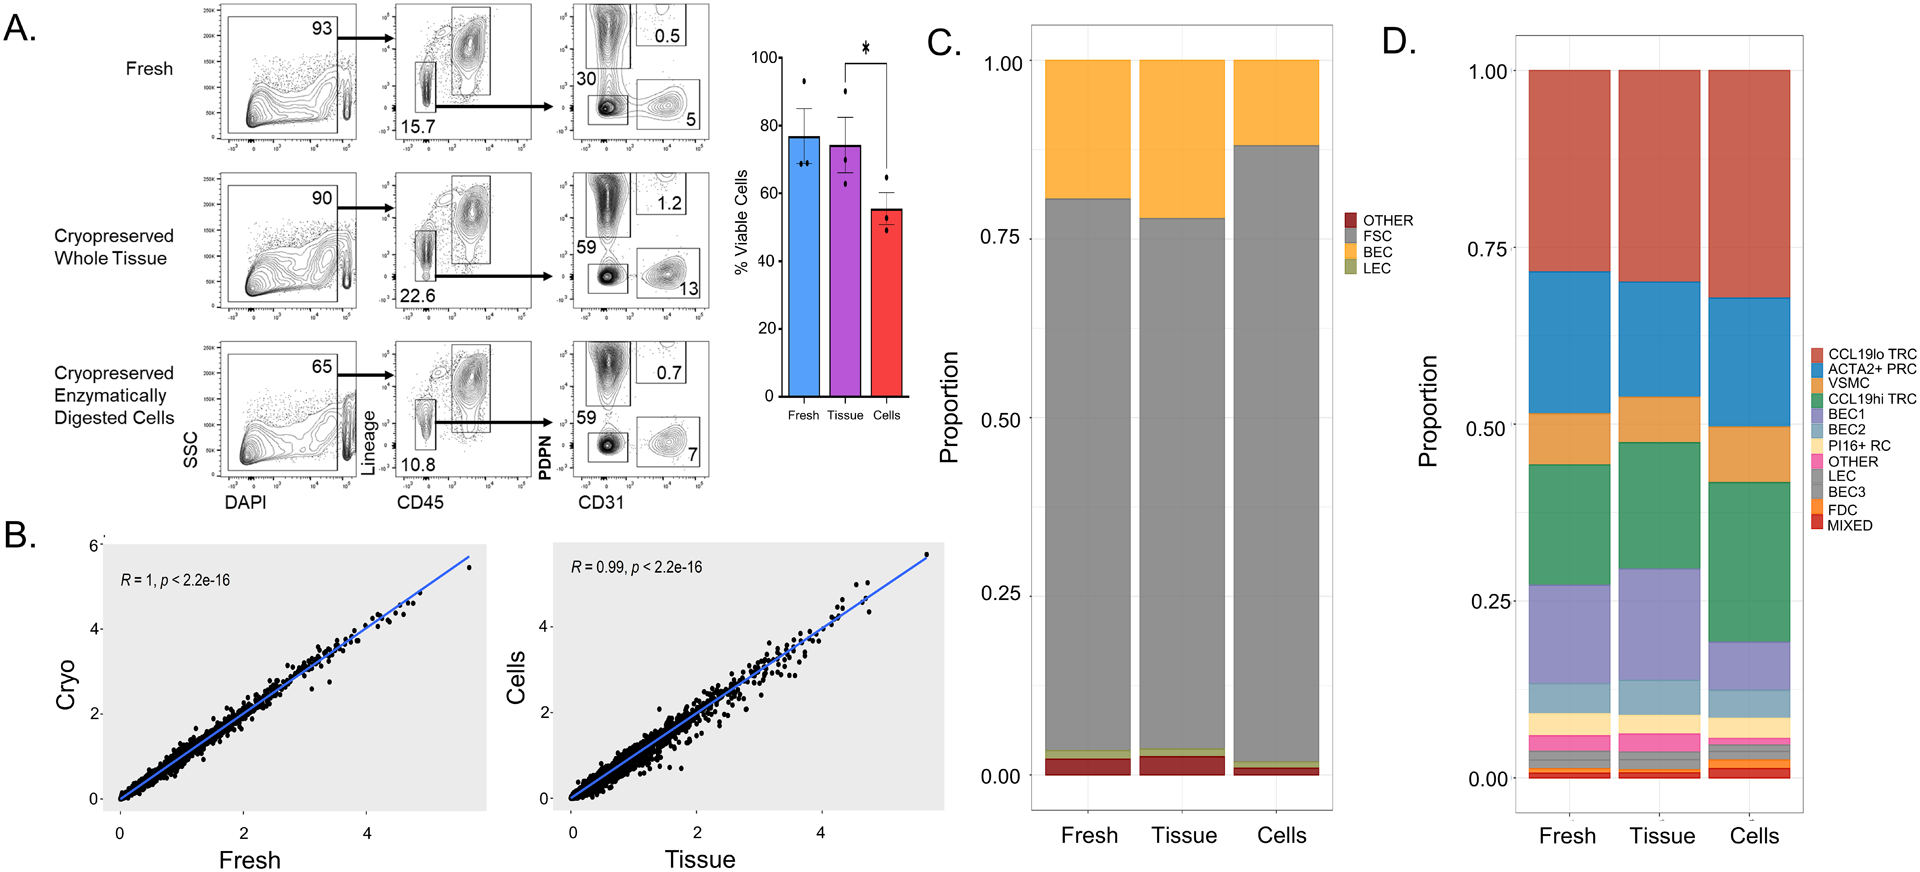
Figure 4. Cryopreservation of enzymatically digested cells impairs viability but preserves stromal cell subsets.

Tonsil fragments were either kept fresh in FBS-containing RPMI at 4°C for two days or cryopreserved either as whole tissue or cells that have been enzymatically digested. (A) Flow cytometry analysis of freshly processed tonsil cells, whole-tissue cryopreserved cells, or cryopreserved enzymatically digested cells. The first column represents live/dead discrimination by DAPI uptake among all singlets. Viability is also shown as a bar graph (n = 3 tonsils) * p < 0.05 by Student’s t-test comparison after one-way ANOVA. Live cells were then analyzed for expression of CD45 and hematopoietic lineage markers (CD3, CD14, CD16, CD19, CD20, CD56) in the second column with gating showing non-hematopoietic cells. These non-hematopoietic cells were then analyzed for expression of the fibroblast marker podoplanin (PDPN) and endothelial marker (CD31) with gating showing fibroblastic stromal cells (PDPN+CD31−), blood endothelial cells (PDPN −CD31+), and lymphatic endothelial cells (PDPN+CD31+). (B) Linear regression of gene expression between (left) freshly processed and cryopreserved tonsil (with “cryo” defined as an average expression of whole tissue and enzymatically digested cell cryopreservation). Linear regression of gene expression between (right) whole tissue and enzymatically digested cell cryopreservation is also shown. Pearson correlation with associated p-value listed in graph. (C) Colors in each bar define the proportion of each subset within the entire sample with fibroblastic stromal cells (FSCs) in grey, blood endothelial cells (BECs) in yellow, lymphatic endothelial cells (LECs) in green, and otherwise un-identified cells (other) in red. (D) Colors in each bar define proportions of each Seurat-defined cluster within the entire sample. Cluster identities were determined via expression of known markers from analysis of freshly processed tonsil in Figure 2.
