. 2023 Aug 16;14(37):10068–10080. doi: 10.1039/d3sc03229a

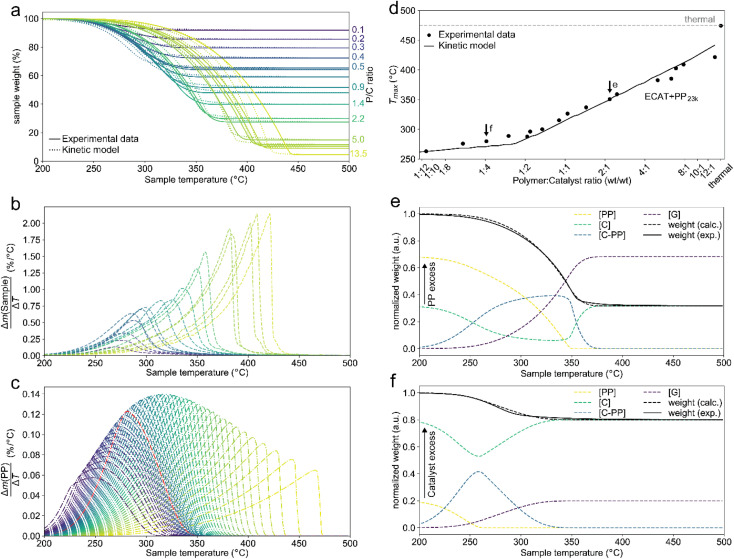
Fig. 2. Results of thermogravimetric analysis (TGA) of PP23k cracking using ECAT at various polymer : catalyst (P : C) ratios and kinetic modelling. Heating rate: 10 °C min−1. (a) TGA profiles and fit of the kinetic model. (b) Derivative TGA profiles in units of total sample weight. (c) Derivative TGA profiles for various P : C ratios predicted by the kinetic model in units of polymer weight. P : C increases from blue to yellow, where pw denotes normalized polymer weight. (d) Plot of the temperatures at which the decomposition rate is highest (Tmax) for cracking of PP23k with ECAT at various P : C ratios as determined experimentally and extrapolated by kinetic modelling. Arrows indicate data points used in the panels below. (e and f) Development of cracking species concentrations determined by kinetic modelling for a P : C ratio of ∼2 : 1 (e), and ∼1 : 4 (f).

Fig. 2