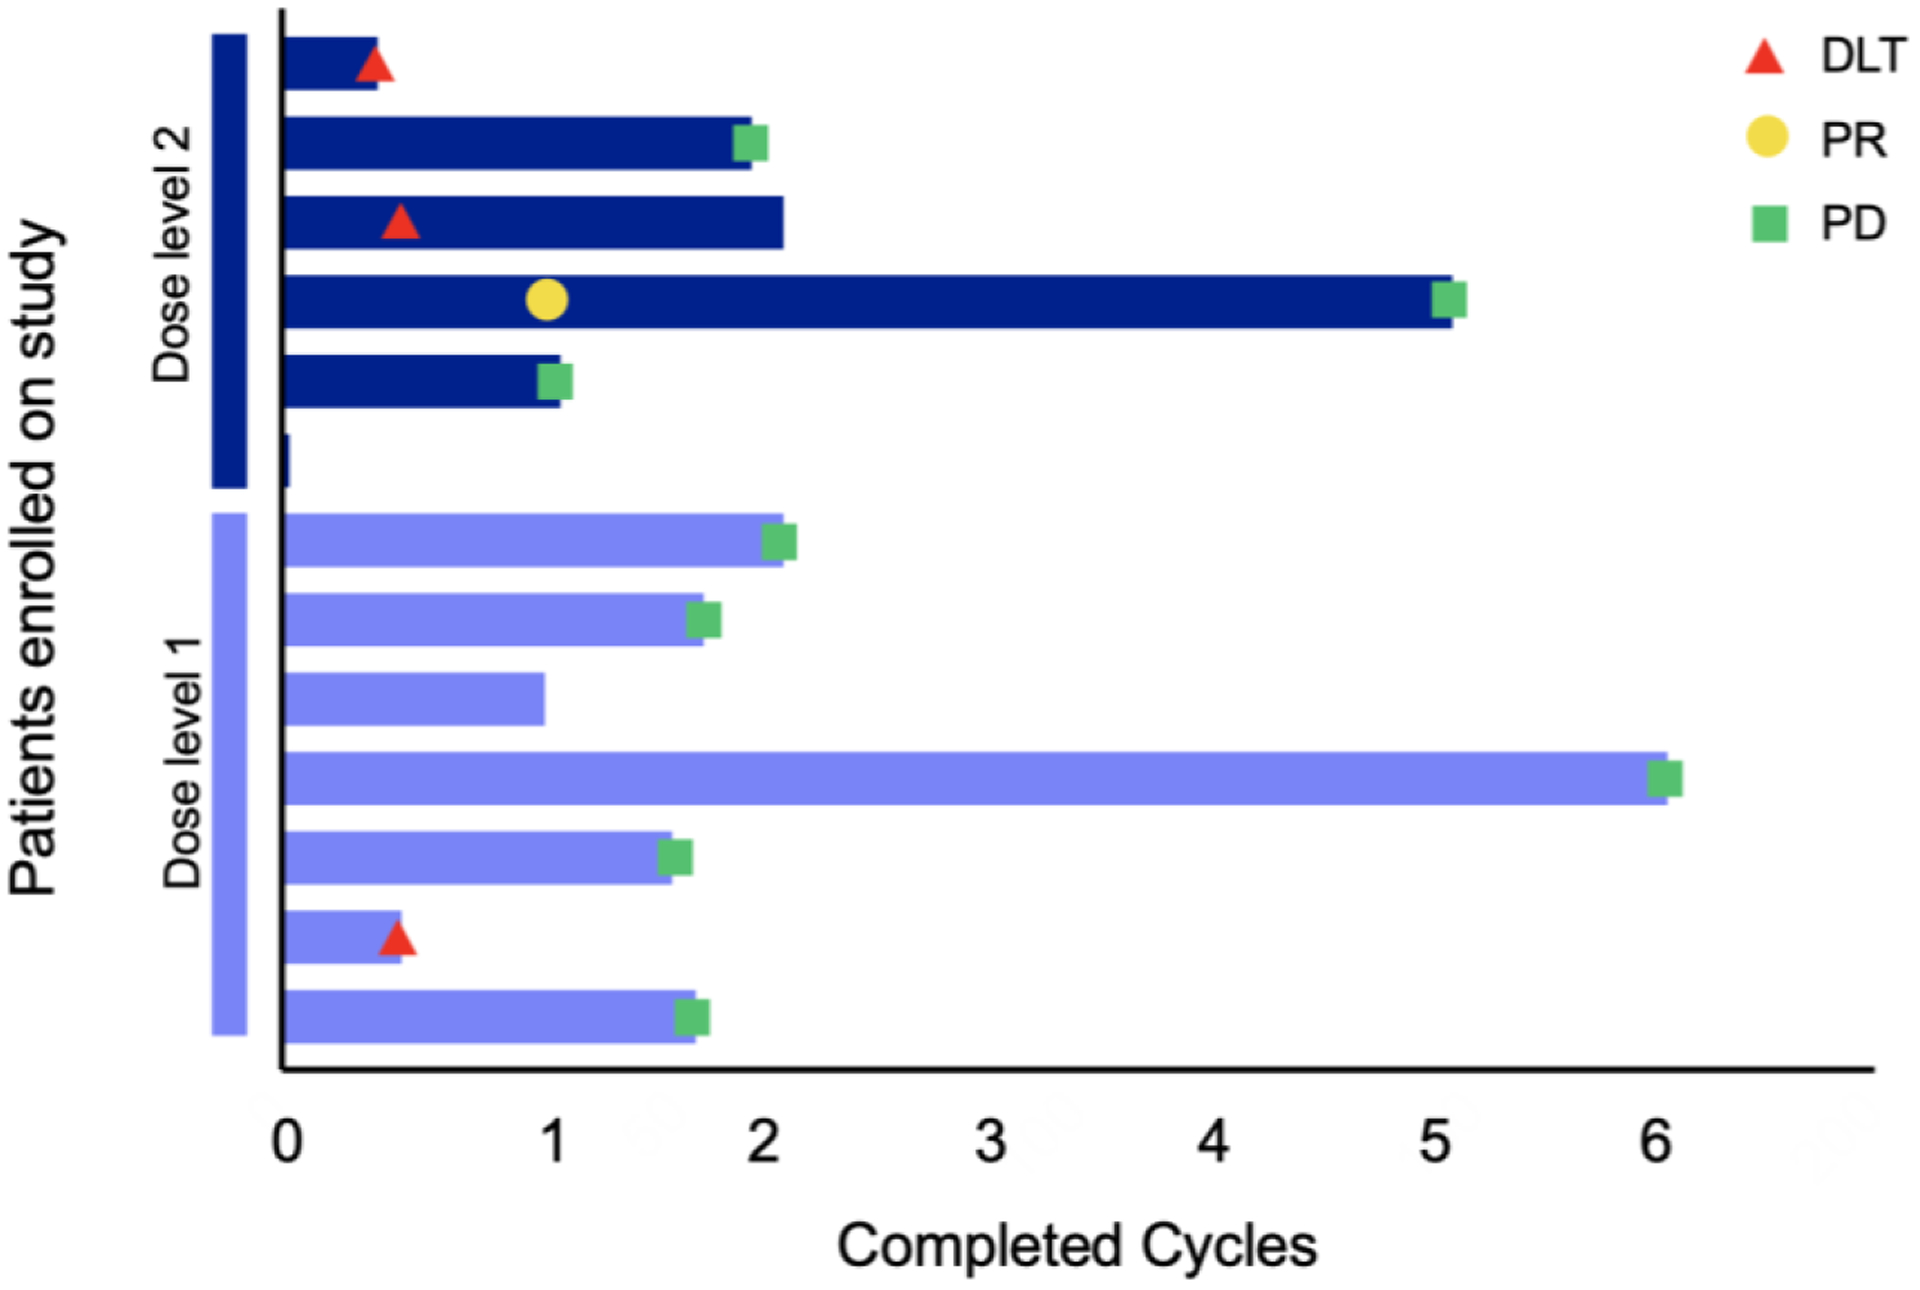
Figure 1:

Swimmer plot depicting summary of treatment duration in cycles, timing of dose-limiting toxicities (DLT) (red), and clinical outcomes of partial reponse (PR) (yellow) and progressive disease (PD) (green) for patients treated at dose level 1 (light blue) and dose level 2 (dark blue).
