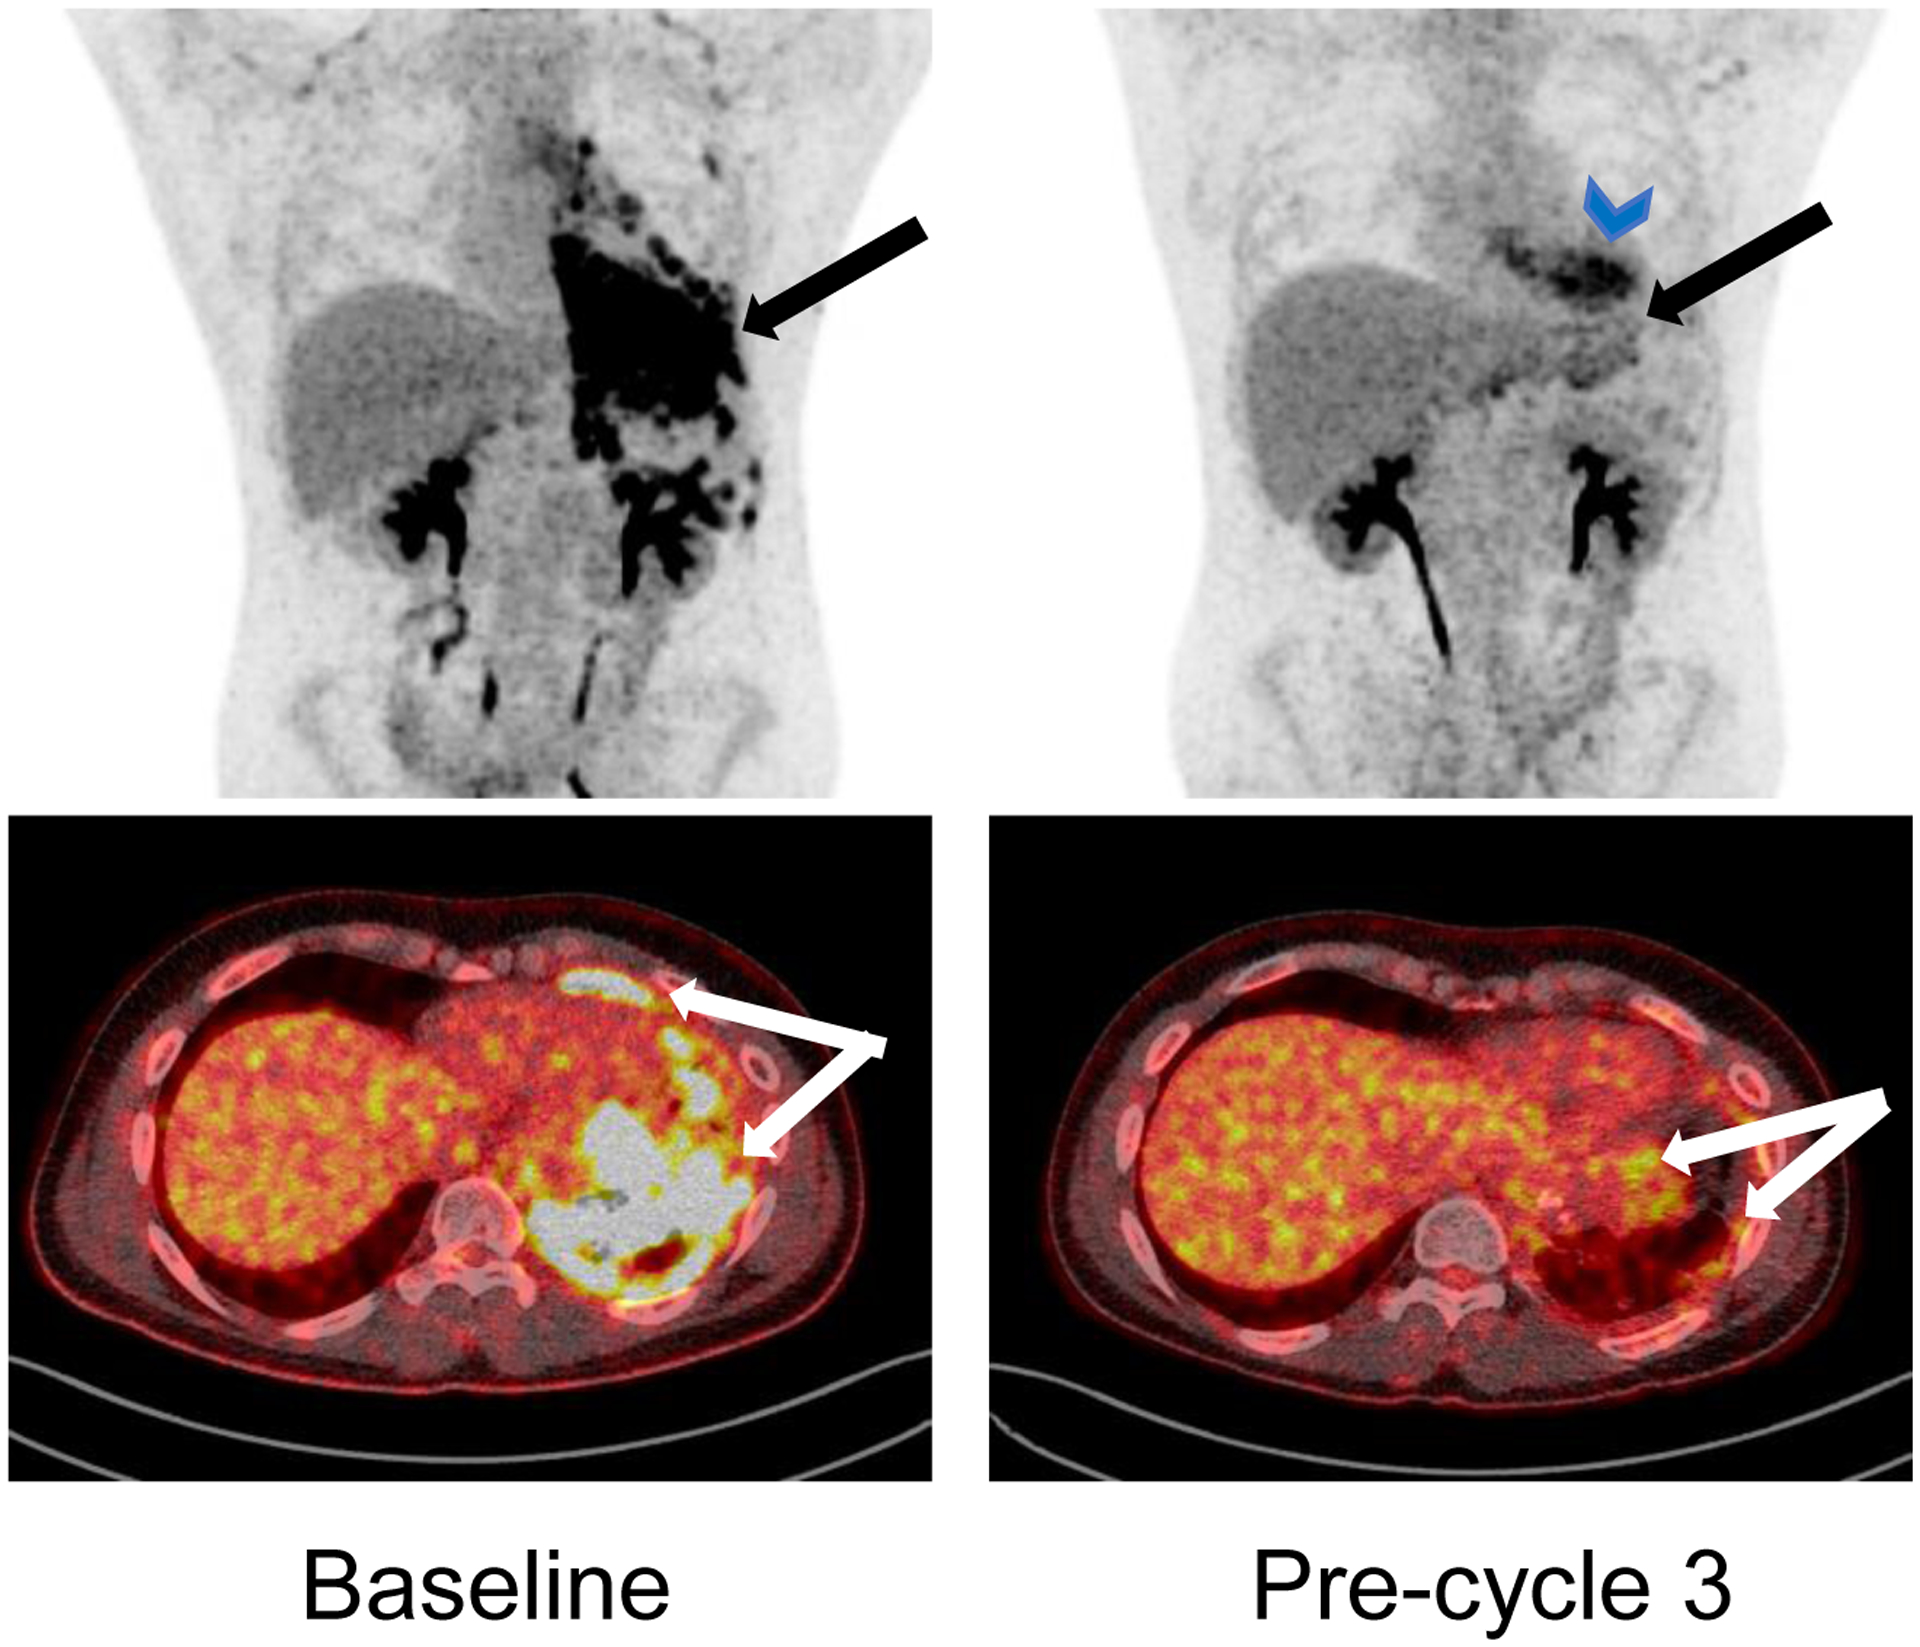
Figure 2:

Coronal and axial 18F-Flurodeoxyglucose positron emission tomography (FDG-PET) scan images for patient who had confirmed partial response. Left panel shows the disease extent at baseline (pre-cycle 1) and the right panel shows the response at the pre-cycle 3 timepoint. The large conglomerate of highly FDG avid masses along the pleural surface are significantly reduced. The blue arrowhead symbol shows physiological uptake in cardiac muscle.
