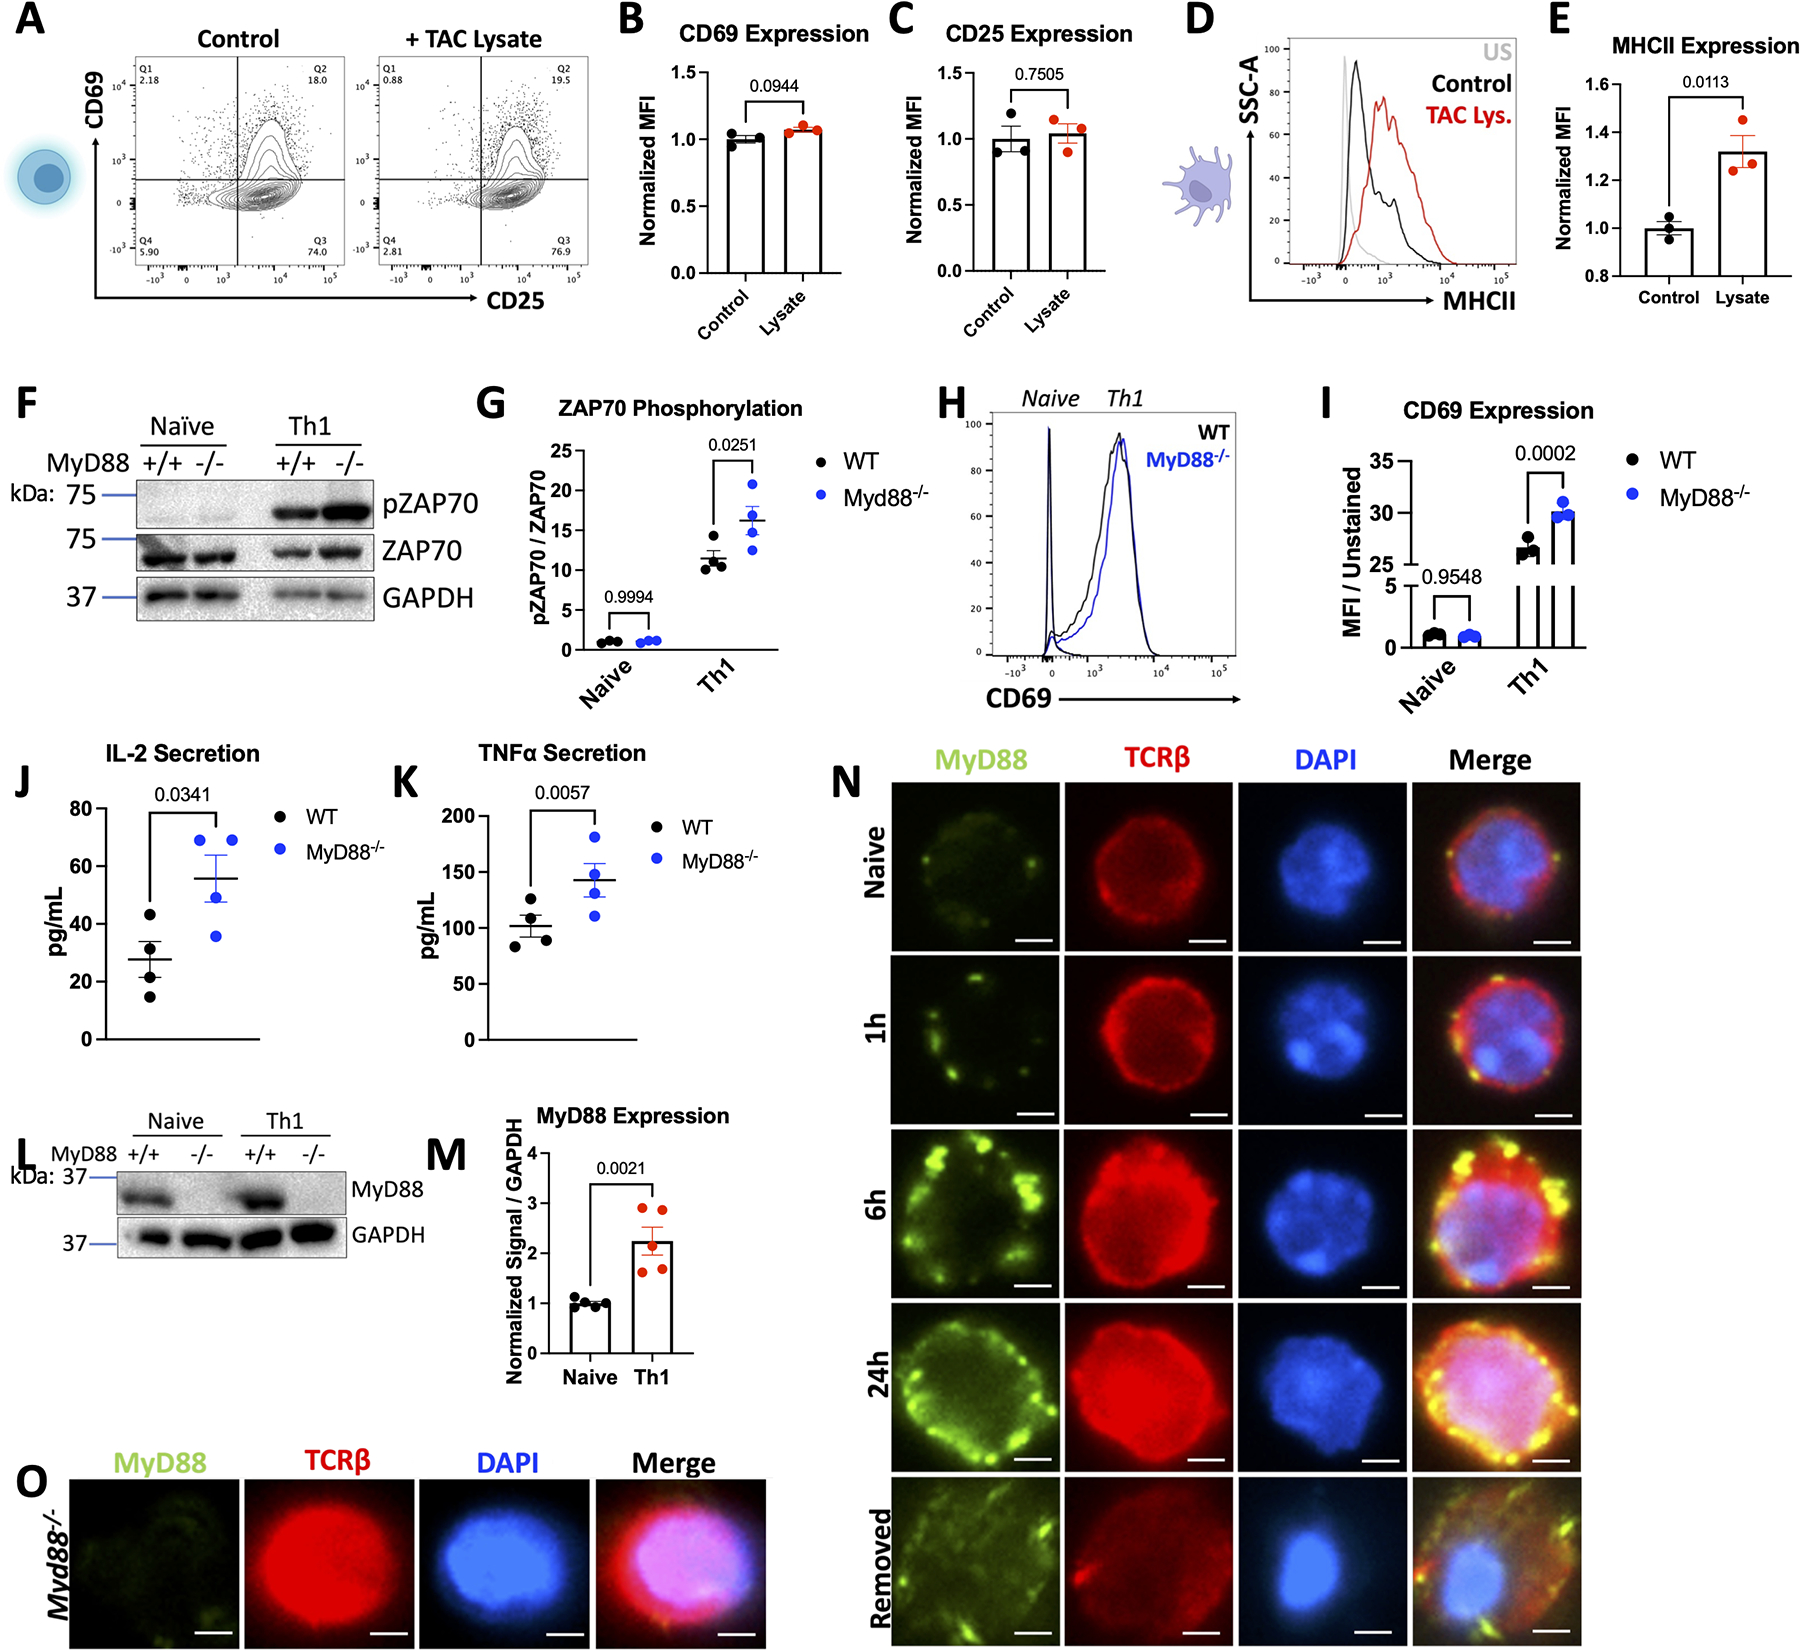
Figure 5: MyD88 Acts as a Break During T-cell Activation through TCR but not TLR signaling.

Th1 cells were cultured in T-cell media with 10 μg/mL of lysate generated from the LV of WT TAC mice for 24 hours, then analyzed by flow cytometry. Example plots shown in in A. with quantification for n=3 independent experiments in B-C. D-E. BMDCs were cultured with 10 μg/mL of TAC lysate for 24 hours, then analyzed by flow cytometry. Representative plots shown in D, with quantification for n=3 independent experiments in E. F. Representative western blots from WT or Myd88−/− Th1 cells, quantified in G. WT or Myd88−/− Naive CD4+ splenocytes or Th1 cells were stained and analyzed by flow cytometry, with representative plots shown in H. quantified in I. from n=3 independent experiments. J-K. Supernatants were collected for ELISA from 1 million WT or Myd88−/− Th1 cells cultured in fresh T-cell media for 24 hours from n=4 independent T-cell preps. L. Representative western blots from WT or Myd88−/− Naive CD4+ or Th1 cells, quantified in M. from n=4 independent experiments. N-O. Naïve WT (N) or Myd88−/− (O) T-cells were plated on coverslips in the absence or presence of αCD3/CD28 for the indicated timepoints, or removed from stimulation for 24 hours, then stained with MyD88 and TCRβ for analysis by fluorescent microscopy. Scale bars are 2 μM. Statistical analysis by T-test (B,C, E, J, K, M), or 2-way ANOVA with Sidák’s multiple comparison test (G, I) P values shown.
