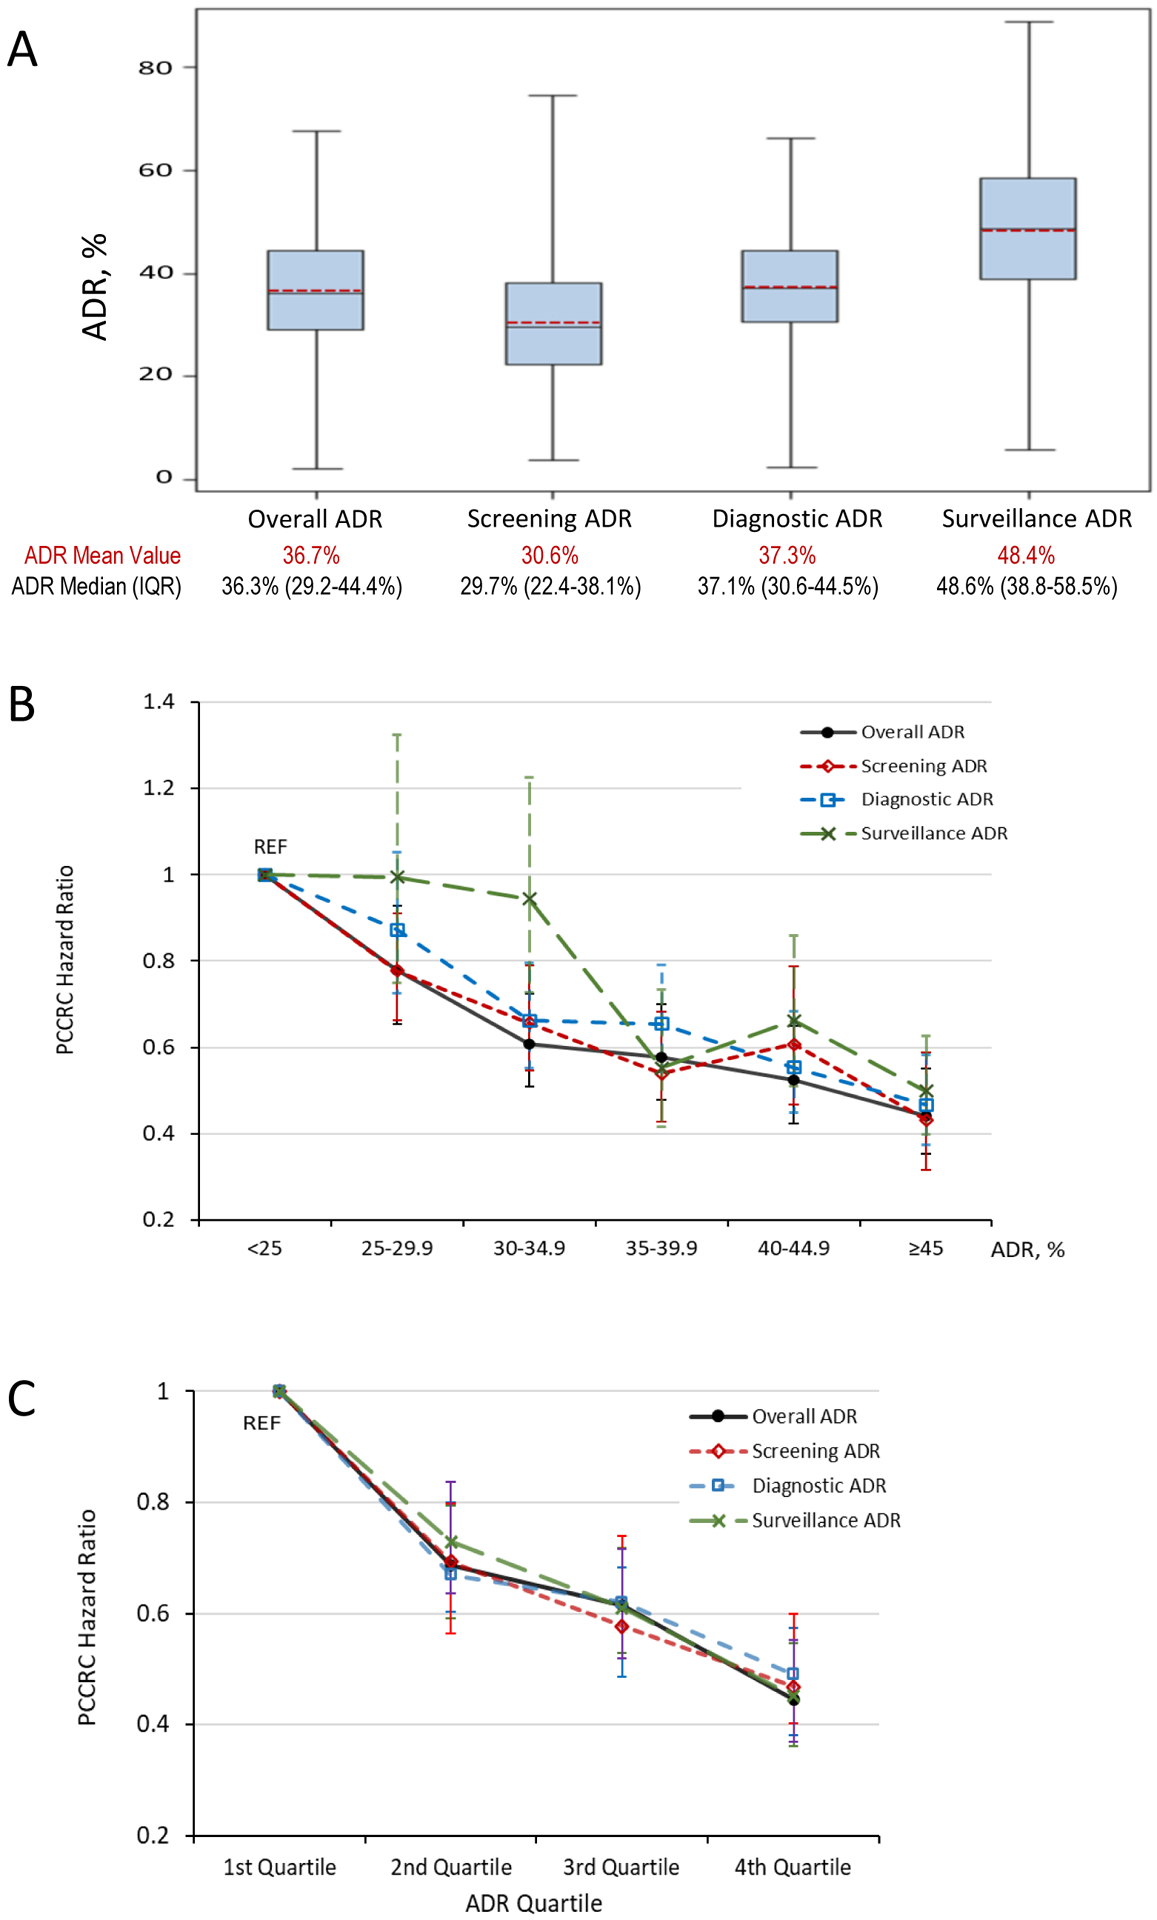
Figure 1.

Adenoma detection rate (ADR) distributions based on colonoscopies performed in 2010–2018 (panel A) and associations between ADR categories and quartiles and risk of postcolonoscopy colorectal cancer (PCCRC) (panel B and panel C).
ADR, adenoma detection rate; IQR, interquartile range; PCCRC, post-colonoscopy colorectal cancer; REF, reference group.
Panel A: The blue boxes represent the second and third ADR quartiles or interquartile range; the horizontal black solid line inside the boxes represents the ADR median; the red dashed line inside the boxes represent the ADR mean value; the whiskers extend to the minimum and maximum ADR values. See Supplementary Table for additional ADR calculation details.
Panel B and C: Hazard ratios were adjusted for health system, sex, race, ethnicity, age, body mass index, Charlson comorbidity score, and colonoscopy year. Error bars represent 95% confidence intervals.
