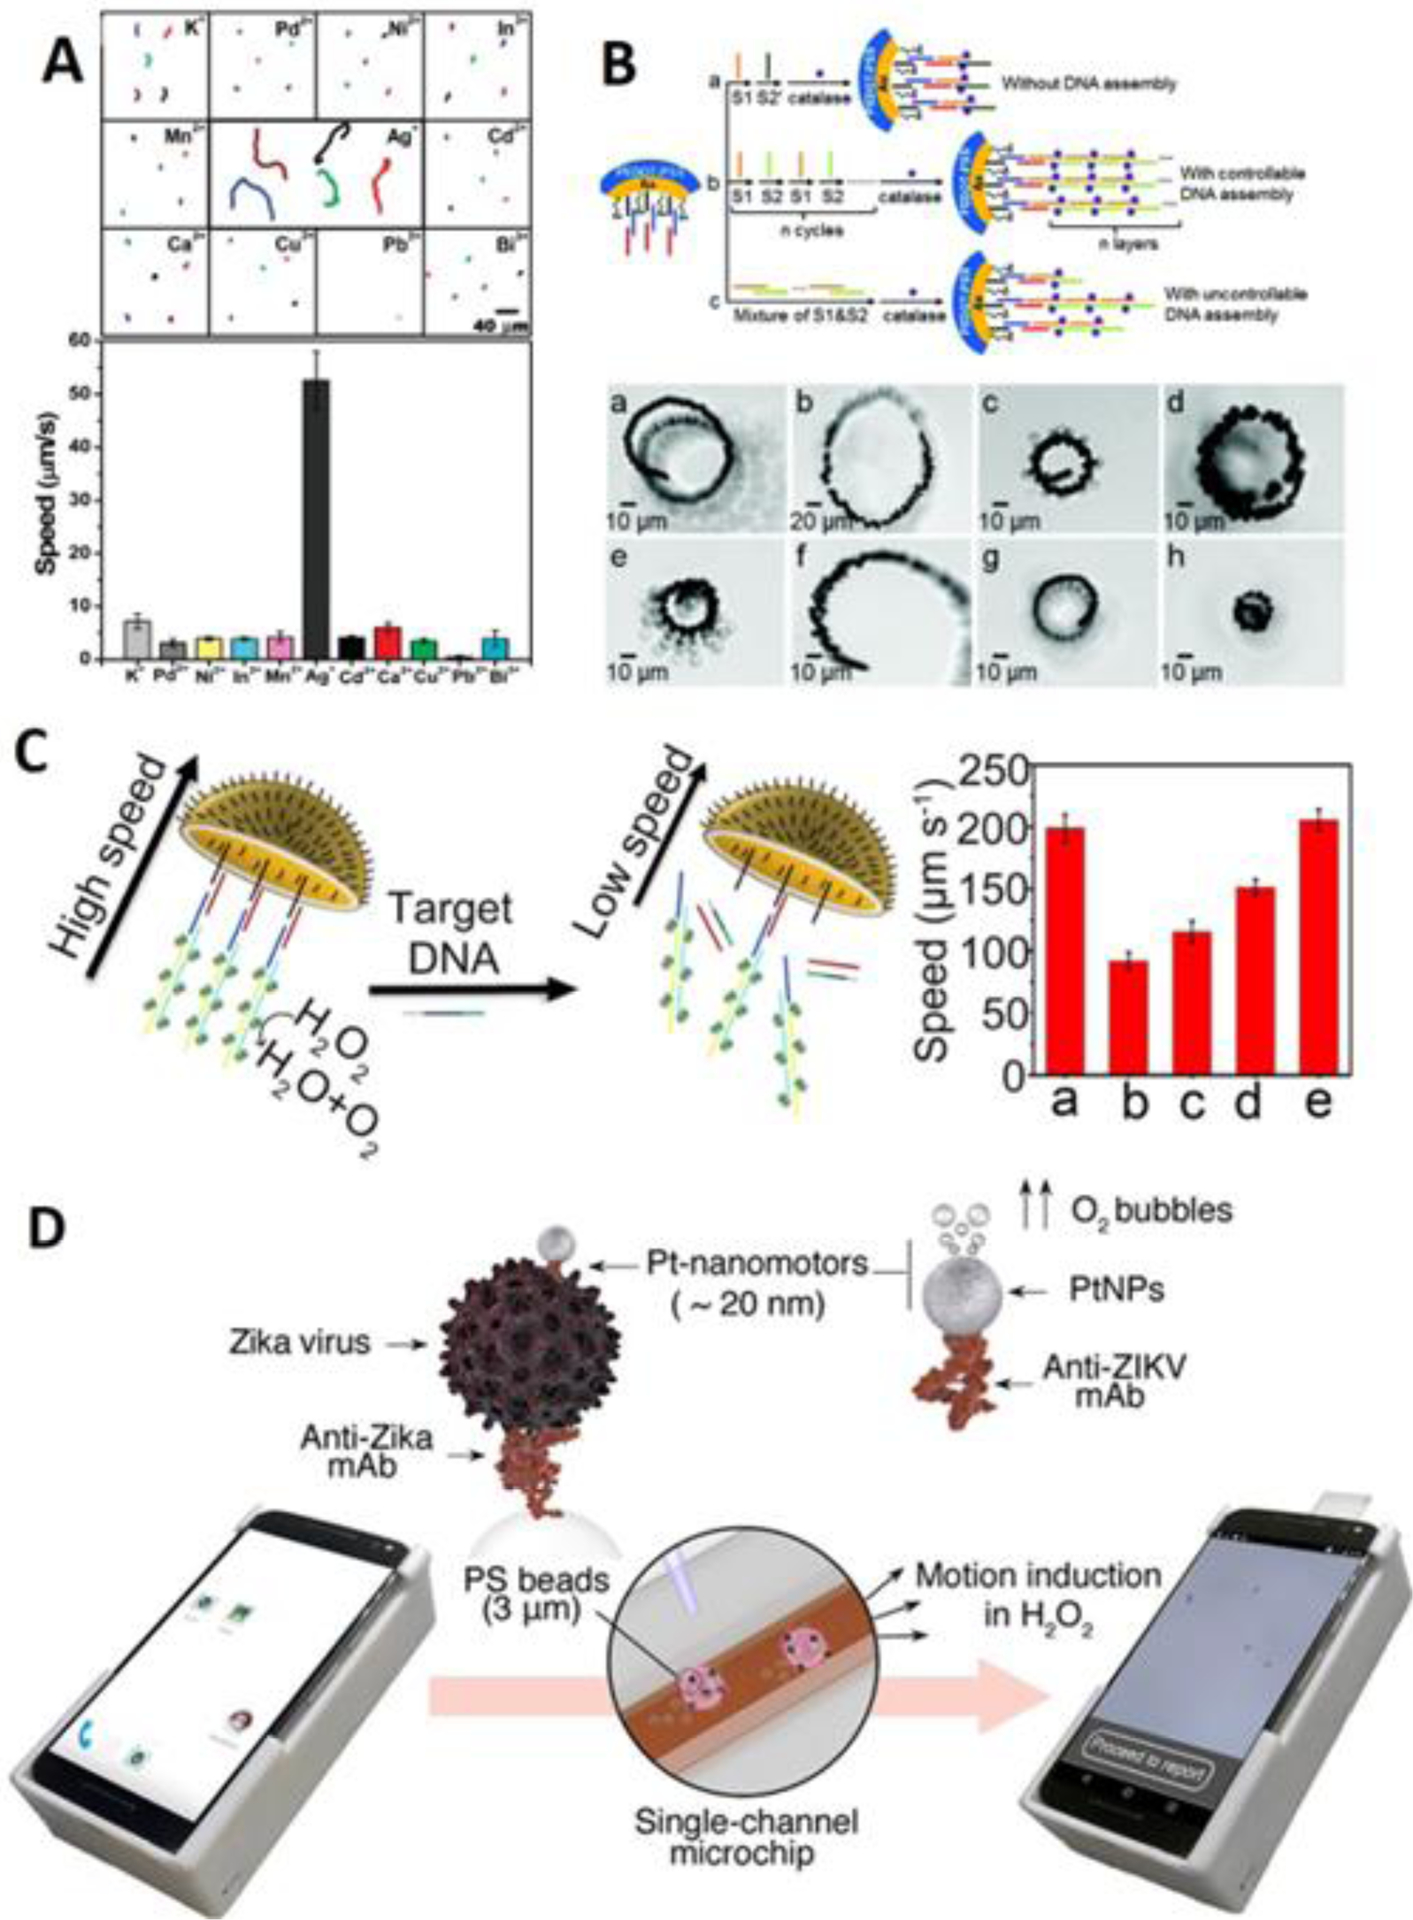
Figure 6. Motion-based sensing.

(A) Motion-based sensing of trace level silver. The reduced silver could accelerate the motion of the nanowire, scale bar: 40 m (reprinted from ref. 94 with permission, copyright 2009, American Chemical Society). (B) Motion-based sensing of DNA improved by cyclic alternate hybridization. The subset of photo from (a) to (h) shows the time-lapse images of micromotors in response to 0, 10, 30, 50, 100, 300, 500 and 1000 nM DNA in 0.2 s, scale bar: 10 m (reprinted from ref. 102 with permission, copyright 2017, American Chemical Society). (C) Motion-based sensing by jellyfish-like micromotor. The plot shows the average speed of micromotor in (a) background, (b) 5 M target DNA, (c) 50 M 1 bp mismatch DNA, (d) 50 M 3 bp mismatch DNA, (d) noncomplementary DNA (reprinted from ref. 103 with permission, copyright 2019, American Chemical Society). (D) Motion-based sensing of Zika virus using smartphone as readout. The screenshots show the motion tracking application interface and data processing (reprinted from ref. 117 with permission, copyright 2018, American Chemical Society).
