
Extended Data Figure 6 |. Evolutionary coupling analysis of RXFP1.
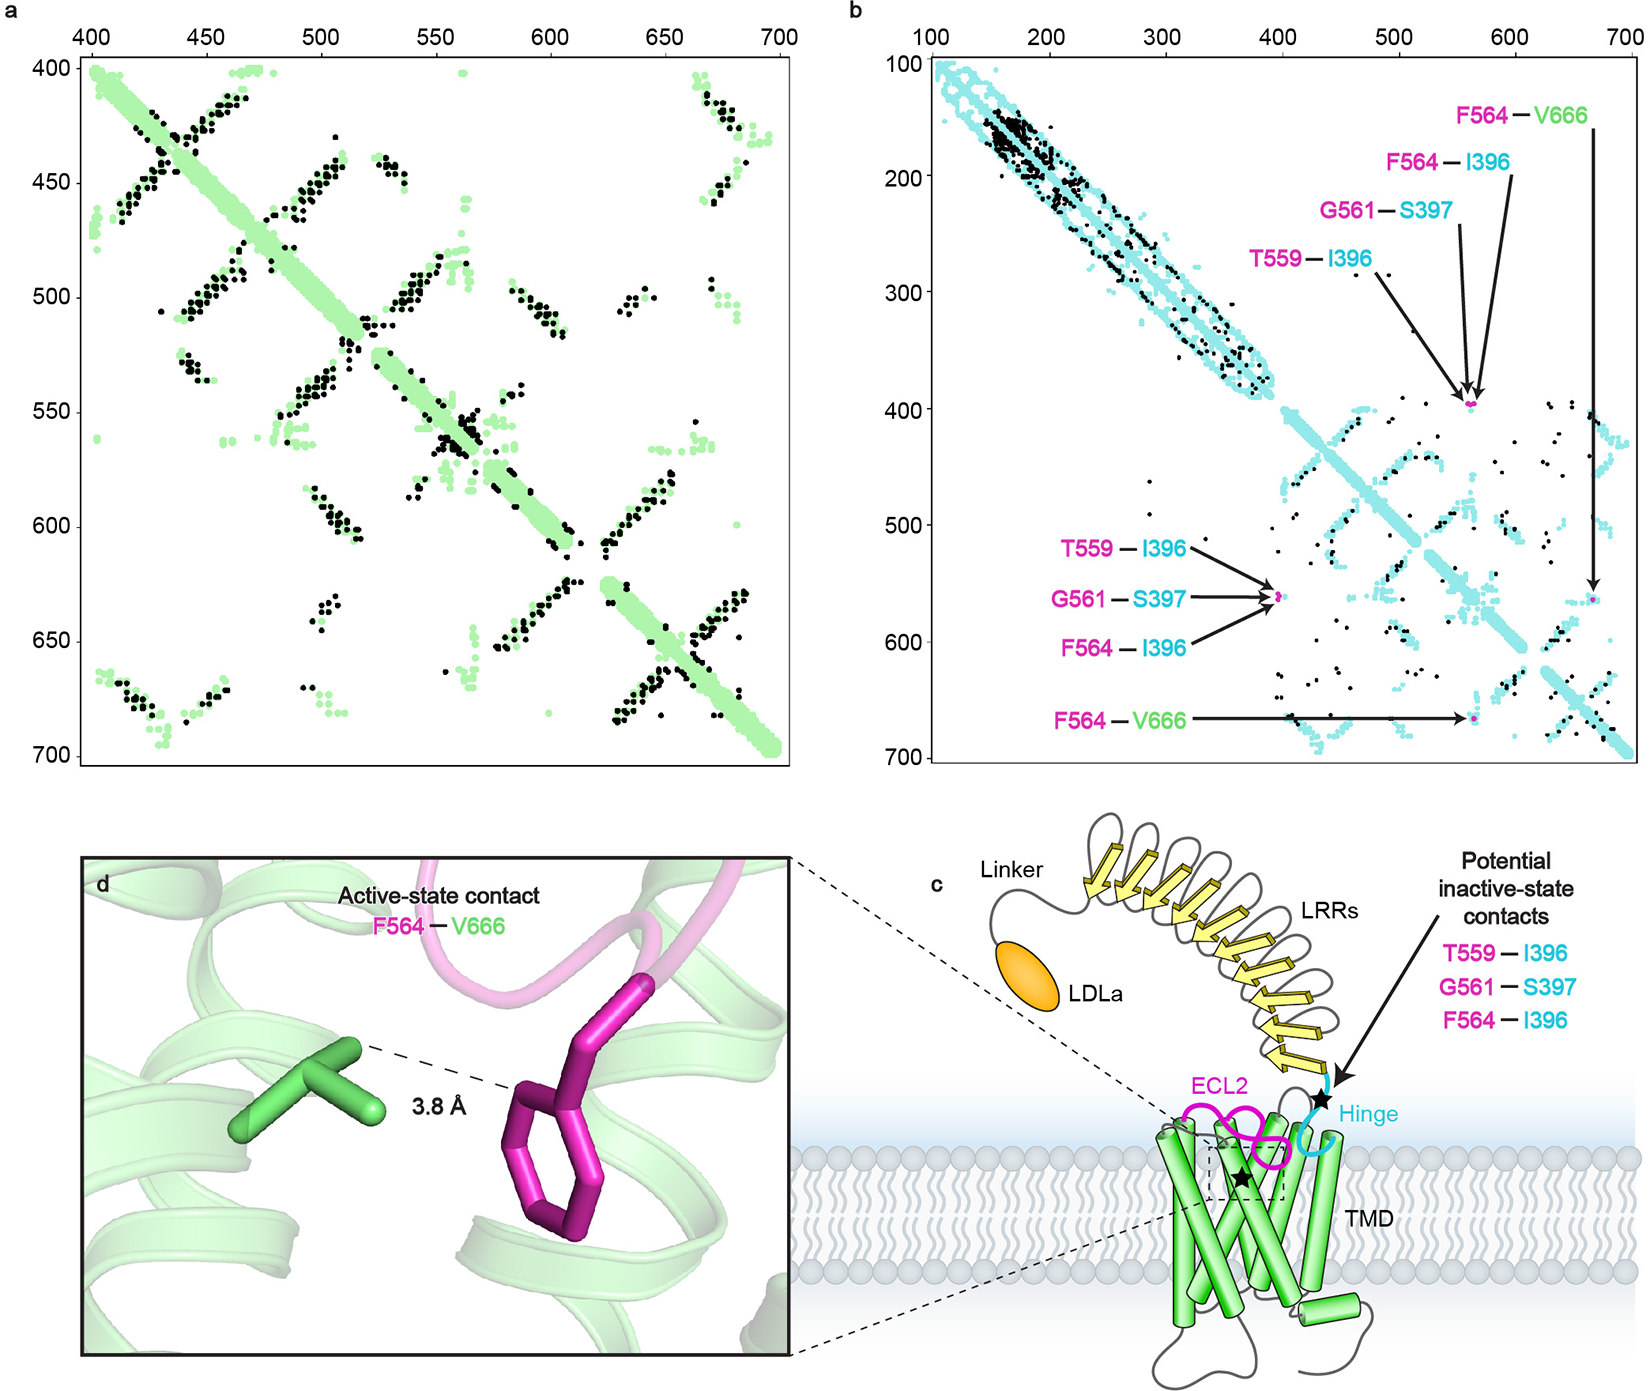
a, Evolutionary couplings for RXFP1 residues 405–689 (black) compared to the active-state structure contacts (green) show close agreement between predicted contacts from ECs and the cryo-EM model. b, Evolutionary couplings for RXFP1 residues 120–757 (black) compared to the active-state 7TM structure and LRR AlphaFold227 model contacts (blue), highlighting ECL2 evolutionary couplings that provide insight into two potential loop conformations in magenta (T559ECL2–Ile396, Gly561ECL2–Ser397, Phe564ECL2–Ile396, Phe564ECL2–Val6667.38). c, Diagram of RXFP1 domains. Stars indicate regions of RXFP1 containing residues with the highest scoring ECs with ECL2, TM7 and the hinge region. d, The Phe564ECL2 and Val6667.38 residues from evolutionary coupling analysis are in close contact in the RXFP1 active-state structure.