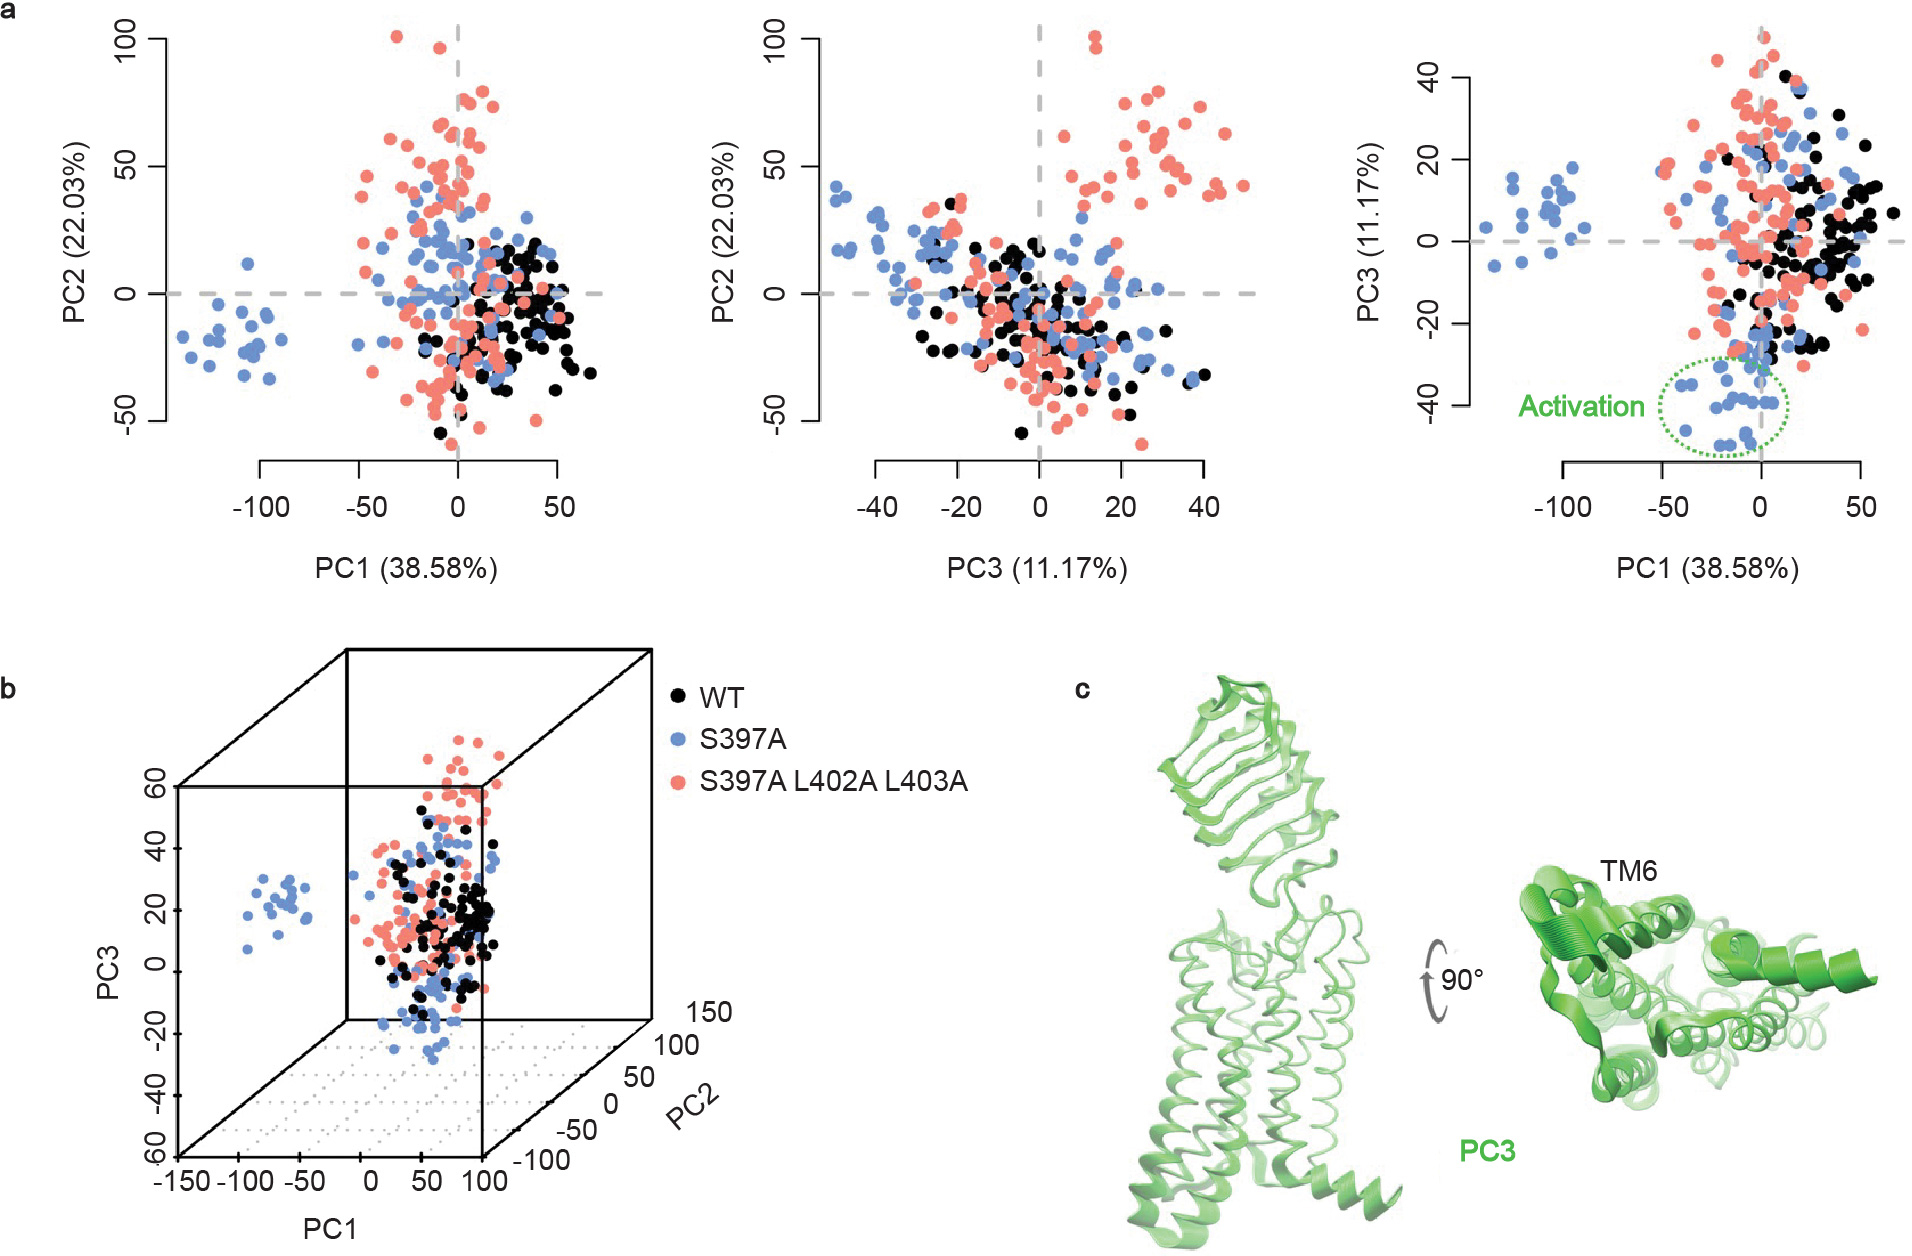
Extended Data Figure 8 |. Principal component analysis.

Principal component analysis of halfLRRs-7TM WT, S397A, and S397A/L402A/L403A are presented together. a-b, Projection of the simulation frames onto the 2D and 3D spaces defined by the 3 largest global PCs, covering 38.58%, 22.03% and 11.17% of the total variance, respectively. Dashed circle indicates (roughly) the active-like conformations of halfLRRs-7TM S397A. c, Conformational variance associated with PC3, reflecting TM6 opening of the S397A mutant upon activation. The same PC was found in the analysis of the S397A mutant alone (PC2 in Fig. 3d). For clarity, only 50 frames per system (1 frame/ns) are shown here.
