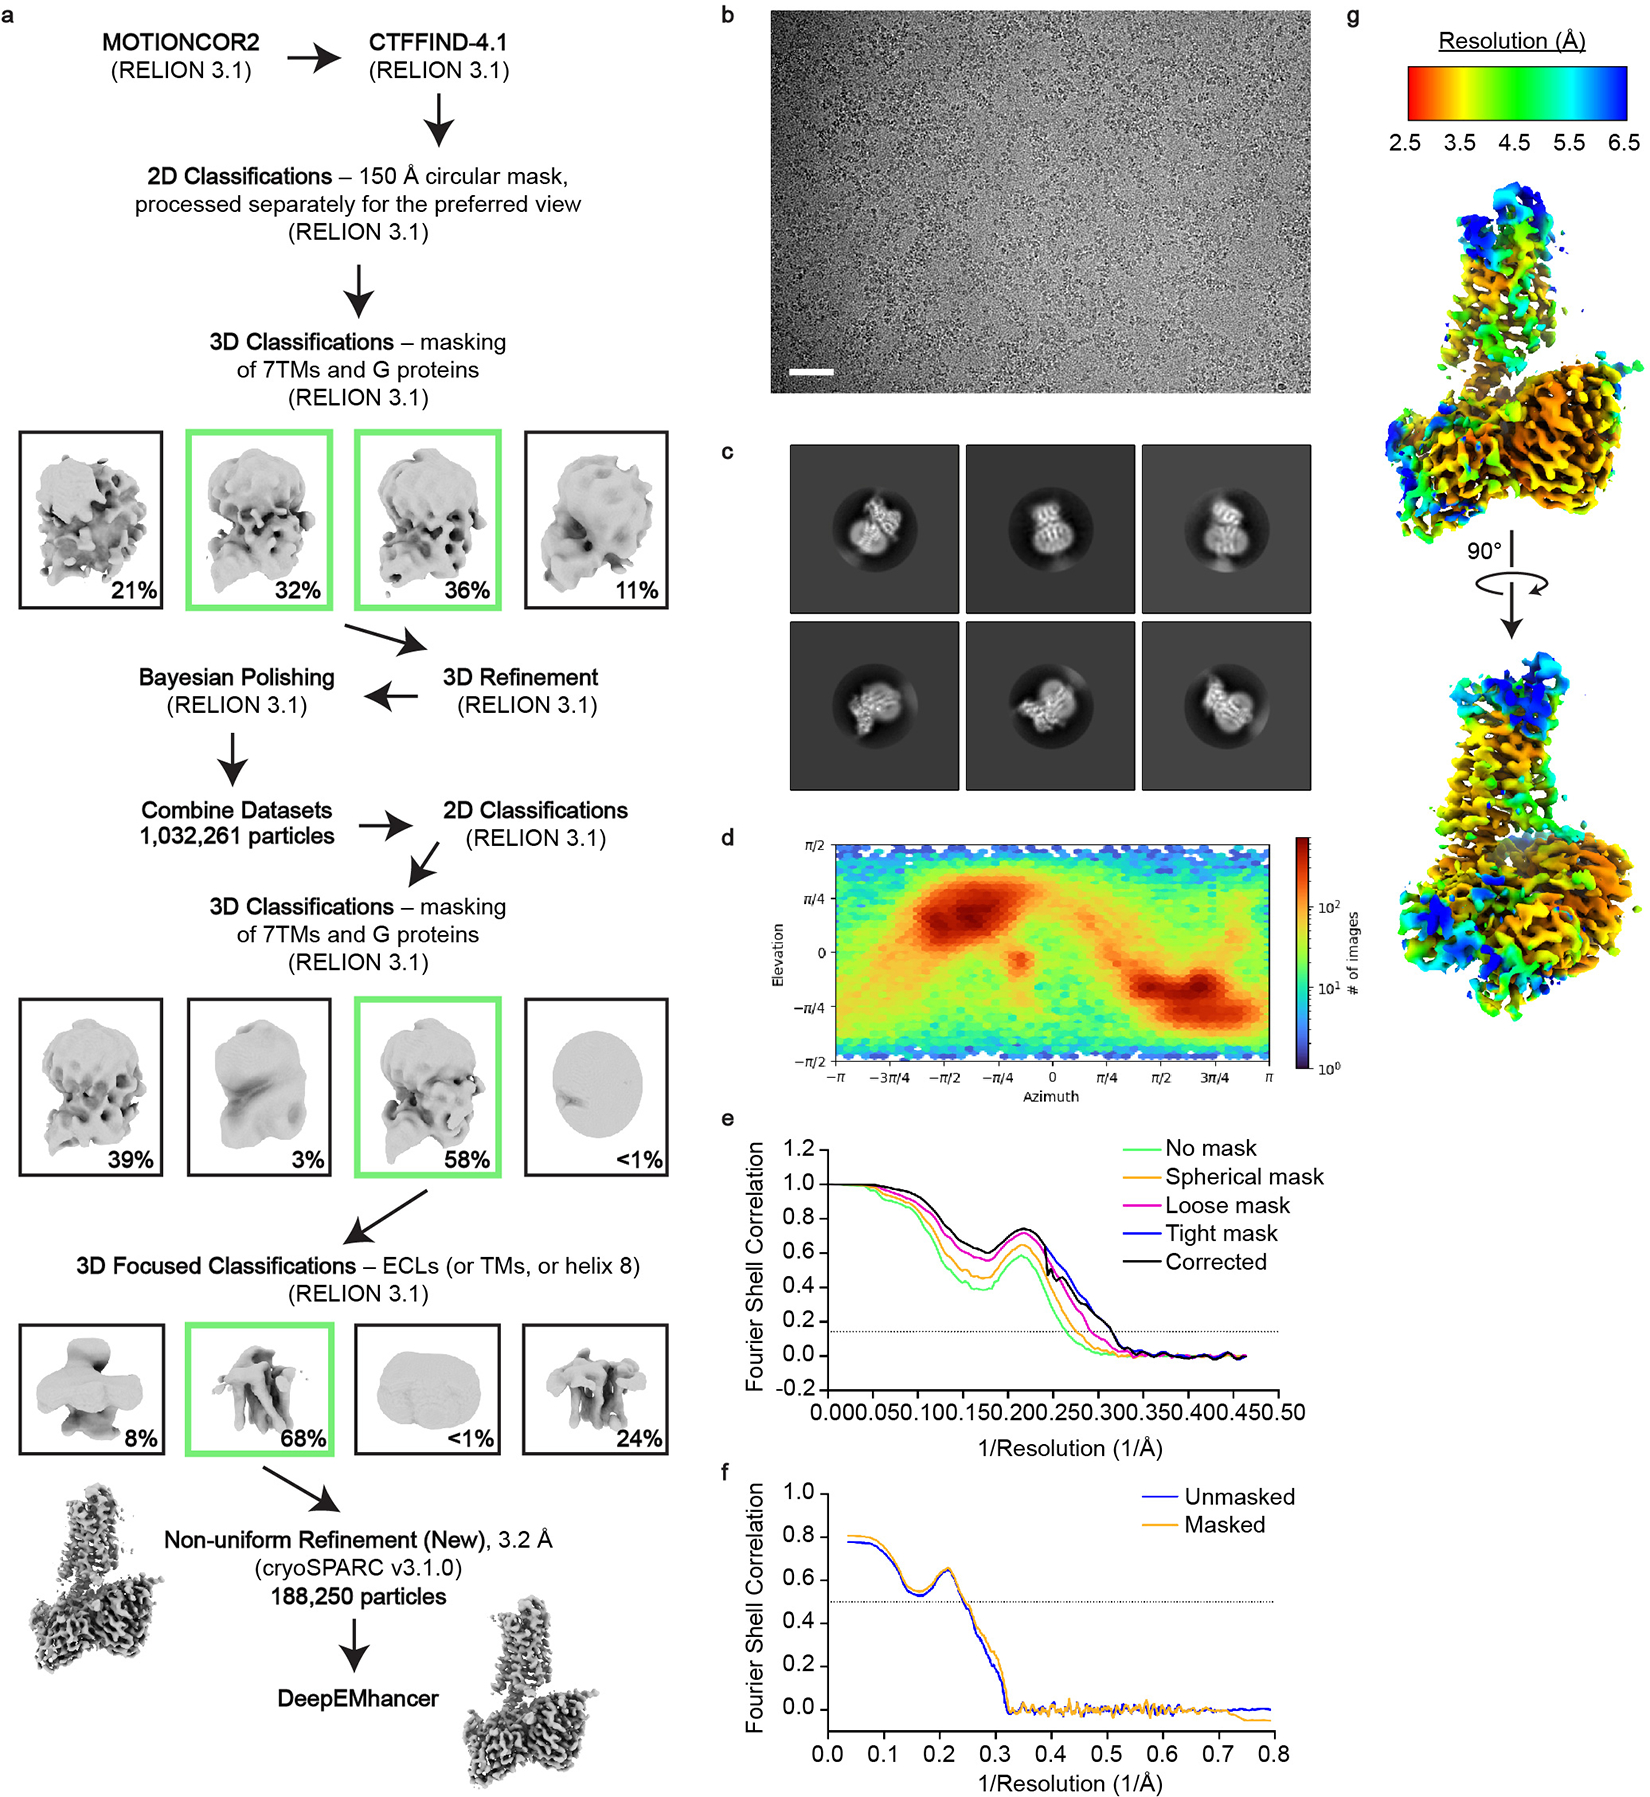
Extended Data Figure 2 |. Cryo-EM data processing for the 7TM domain of RXFP1–Gs.

a, Cryo-EM data processing scheme for the 7TM domain of RXFP1 in complex with Gs. Shown are representative processing steps for one of four individual datasets and the steps used for the combined datasets. b, Representative micrograph from the RXFP1–Gs complex datasets (Scale bar = 50 nm; from 13,457 micrographs). c, Two-dimensional class averages for the 7TM domain of RXFP1 and G proteins. d, Angular distribution of particles in the final refinement for the 7TM domain with G proteins. e, Fourier shell correlation (FSC) used to determine the overall map resolution. f, Map to model FSC curve. g, cryoSPARC non-uniform refinement map colored by local resolution.
