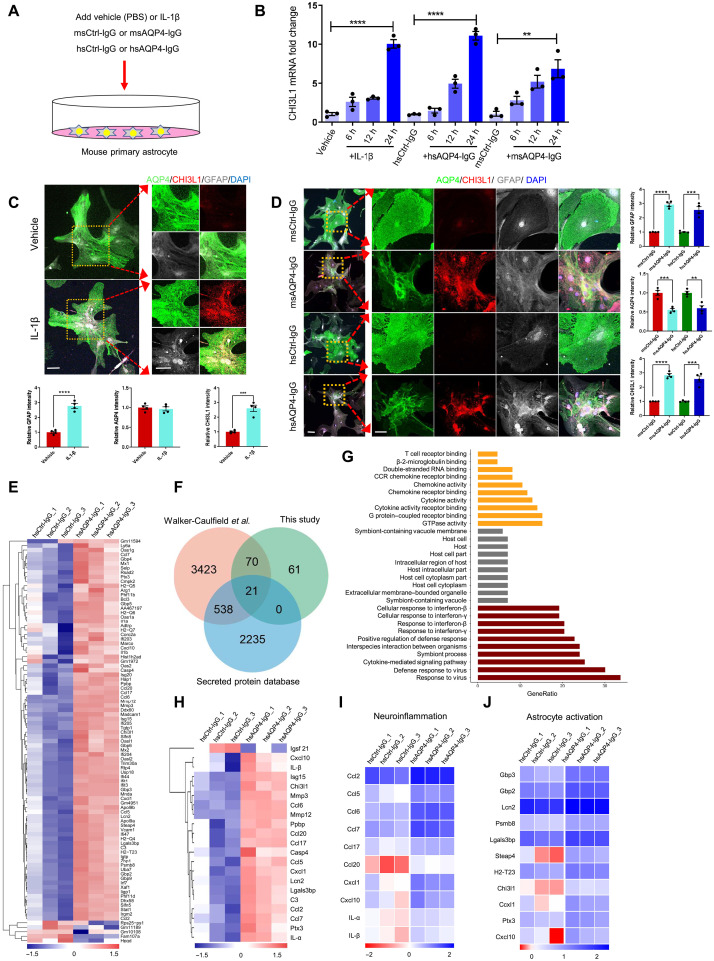
Fig. 1. Characterization of CHI3L1 induction and inflammatory features of primary astrocytes activated by the proinflammatory stimuli.
(A) Schematic diagram showing the treatment of primary mouse astrocyte cultures with IL-1β (100 ng/ml) or PBS, the monoclonal mouse antibodies against AQP4 (msAQP4-IgG, 100 ng/ml) or the control mouse IgG (msCtrl-IgG, 100 ng/ml), and human anti-AQP4 autoantibodies purified from NMO patients (hsAQP4-IgG, 100 ng/ml) or control human IgG (hsCtrl-IgG, 100 ng/ml). (B) Relative levels of CHI3L1 mRNA in primary astrocytes treated with IL-1β, msAQP4-IgG, or hsAQP4-IgG. n = 3. (C) Representative images and quantification of astroglial marker expression in astrocyte cultures treated with PBS or IL-1β after 24 hours. n = 4. (D) Representative images and quantification of astroglial marker expression in astrocyte cultures treated with msAQP4-IgG or hsAQP4-IgG, alongside msCtrl-IgG or hsCtrl-IgG for 24 hours. n = 4. (E) RNA-seq of hsCtrl-IgG– and hsAQP4-IgG–treated astrocytes, with 91 DEGs being overlapped with the dataset of Walker-Caulfield et al. (37), shown in hierarchical clustering heatmap of gene fold changes (normalized to the untreated astrocytes). (F) Venn diagram of the overlapped DEGs in comparison to the genome-wide dataset of all secreted proteins. (G) GO enrichment analysis of the 91 overlapped DEGs. (H) Hierarchical clustering of 21 overlapped DEGs that were secreted proteins. (I) Analysis of the gene fold changes in the overlapped DEGs with the GO of neuroinflammation. (J) Analysis of the gene fold changes in the overlapped DEGs by the gene set of astrocyte activation [Zamanian et al. (42); “reactive”]. Scale bar, 100 μm. The bar graphs were presented as means ± SEM; the statistical evaluation of (C) and (D) was performed with Student’s t test for two conditions; for (B), with one-way analysis of variance (ANOVA) and Tukey’s post hoc multiple comparisons. **P < 0.01, ***P < 0.001, ****P < 0.0001.

