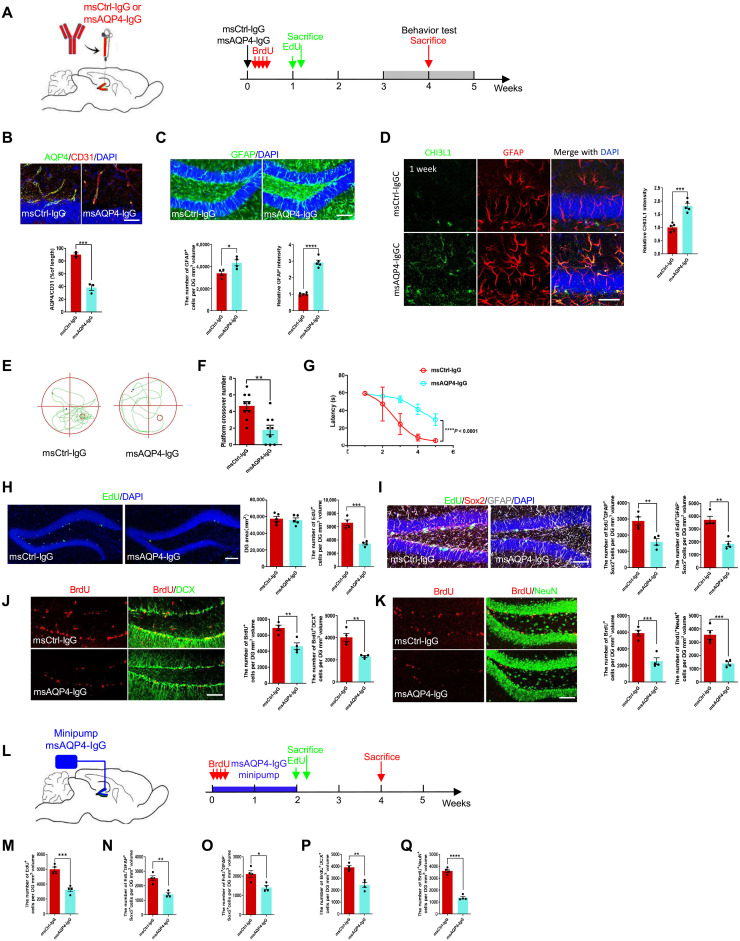
Fig. 3. The effects of immune-mediated astroglial activation on hippocampal neurogenesis and cognitive performance.
(A) Schematic diagram of assays for hippocampal neurogenesis (EdU and BrdU labeling) and cognitive performance with stereotaxic injections of control (msCtrl-IgG) or monoclonal mouse anti-AQP4 antibodies (msAQP4-IgG). (B) Analysis of AQP4 expression in astrocytes [at end-feet along microvessels (CD31+)] in msCtrl-IgG– or msAQP4-IgG–injected hippocampus. n = 3 animals. Scale bar, 20 μm. (C) Quantification of astrogliosis (GFAP) by msAQP4-IgG treatment within the volume of injected DG determined by 3D rendering of confocal images. n = 3. Scale bar, 100 μm. (D) Assessment of CHI3L1 expression in astrocytes induced by msAQP4-IgG. n = 3. Scale bar, 20 μm. (E) Representative movement paths of msCtrl-IgG– or msAQP4-IgG–injected mice in MWM. (F) MWM platform crossing numbers. n = 9. (G) Escape latencies to find the platform in MWM. n = 9. (H) Representative images and analyses of the proliferating cells (EdU+) in hippocampus SGZ. n = 5. Scale bar, 100 μm. (I) Quantification of radial glia–like NSCs (EdU+GFAP+Sox2+) and transiently amplifying progenitor-like cells (EdU+GFAP−Sox2+). n = 4. Scale bar, 100 μm. (J) Analysis of immature neurons (DCX+) differentiated from NSCs (BrdU+) after msCtrl-IgG or msAQP4-IgG injections. n = 4. Scale bar, 100 μm. (K) Analysis of mature neurons (NeuN+) differentiated from NSCs (BrdU+) after msCtrl-IgG or msAQP4-IgG injections. n = 4. Scale bar, 100 μm. (L) Schematic diagram of assays for hippocampal neurogenesis and cognitive performance with mini-pump infusion of msCtrl-IgG or msAQP4-IgG. (M to O) Quantification of total proliferating (EdU+) cells, radial glia–like NSCs (EdU+GFAP+Sox2+), and transiently amplifying progenitor-like cells (EdU+GFAP−Sox2+) in IgG-infused DG. n = 4. (P and Q) Quantification of newborn immature (BrdU+DCX+) neurons and mature (BrdU+NeuN+) neurons in IgG-infused DG. n = 4. Bar graphs presented in means ± SEM; (B) to (D), (F), (H) to (K), and (M) to (Q), by Student’s t test; (G), by two-way ANOVA with Tukey’s multiple comparisons. *P < 0.05, **P < 0.01, ***P < 0.001.

