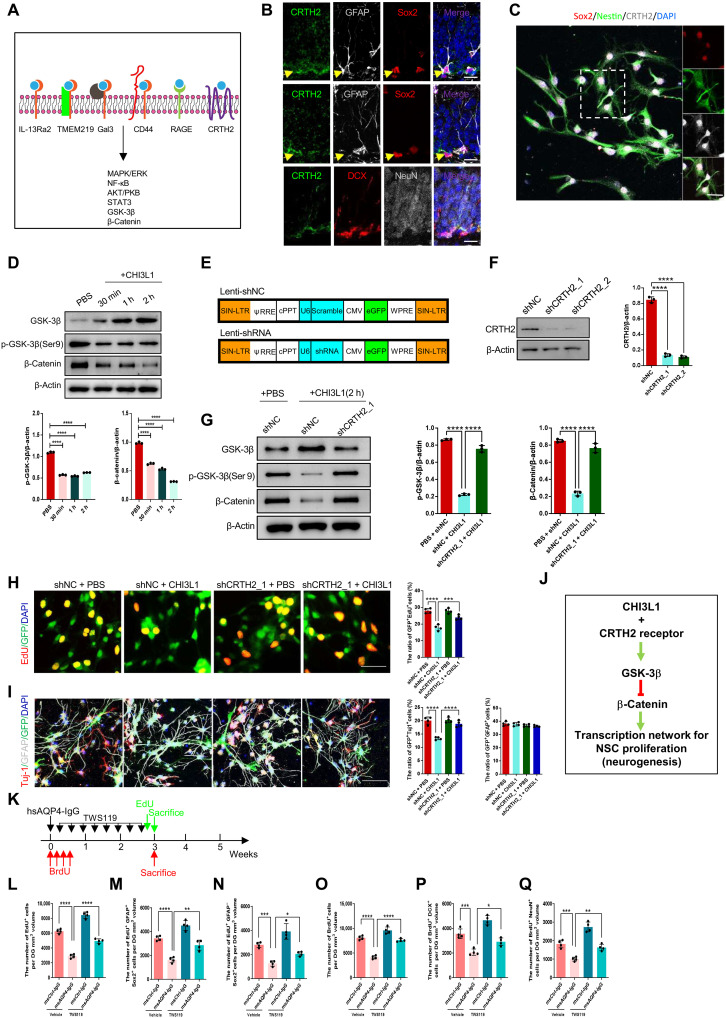
Fig. 5. The CHI3L1 receptor and downstream pathway in NSCs to regulate neurogenesis in neuroinflammation.
(A) Summary of CHI3L1 receptors and downstream signaling pathways. (B) Expression of CRTH2 receptor in NSCs (GFAP+Sox2+) but not immature (DCX+) or mature (NeuN+) neurons in adult hippocampus. Scale bars, 20 μm. (C) CRTH2 expression in cultured NSCs (Sox2+Nestin+). (D) Activation of GSK-3β (reduced inhibitory serine-9 phosphorylation) and inhibition of β-catenin (increased degradation) in NSC cultures treated with CHI3L1 (100 ng/ml). n = 3. (E) Lentiviral vectors to express two shRNAs for CRTH2 knockdown (Lenti-shCRTH2, shCRTH2_1, and shCRTH2_2) and a control shRNA (Lenti-shNC). (F) shRNA-mediated CRTH2 knockdown efficiency. n = 3. (G) CRTH2 knockdown effect on GSK-3β/β-catenin pathway activation by CHI3L1 (2-hour treatment). n = 3. (H) CRTH2 knockdown effect on NSC proliferation in shRNA-expressing cultures, with or without CHI3L1 for 3 days. n = 4. Scale bars, 100 μm. (I) CRTH2 knockdown effect on NSC differentiation into neurons (Tuj1+) and glia (GFAP+) in shRNA-expressing cultures, with or without CHI3L1 for 3 days. n = 4. Scale bars, 100 μm. (J) Identified CHI3L1 signaling pathway inhibitory to neurogenesis: CHI3L1 binds to CRTH2 receptor and activates GSK-3β that in turn phosphorylates and destabilizes β-catenin and leads to reduced transcriptional activities for neurogenesis. (K) Timeline for assays of NSC proliferation and neuronal differentiation in msCtrl-IgG– or msAQP4-IgG–injected mice, receiving a potent GSK-3β inhibitor, TWS119 (30 mg/kg), intraperitoneally daily for 3 weeks. (L to N) Quantification of total proliferating cells (EdU+), radial glia–like NSCs (EdU+GFAP+), and transiently amplifying progenitor-like (EdU+GFAP−) cells. n = 4. (O to Q) Quantification of proliferating cells (BrdU+) at the time of hsAQP4-IgG injection, newborn immature neurons (BrdU+DCX+), and mature neurons (BrdU+NeuN+). n = 4. All bar graphs presented in means ± SEM and analyzed by one-way ANOVA and Tukey’s post hoc analyses. *P < 0.05, **P < 0.01, ***P < 0.001, ****P < 0.0001.

