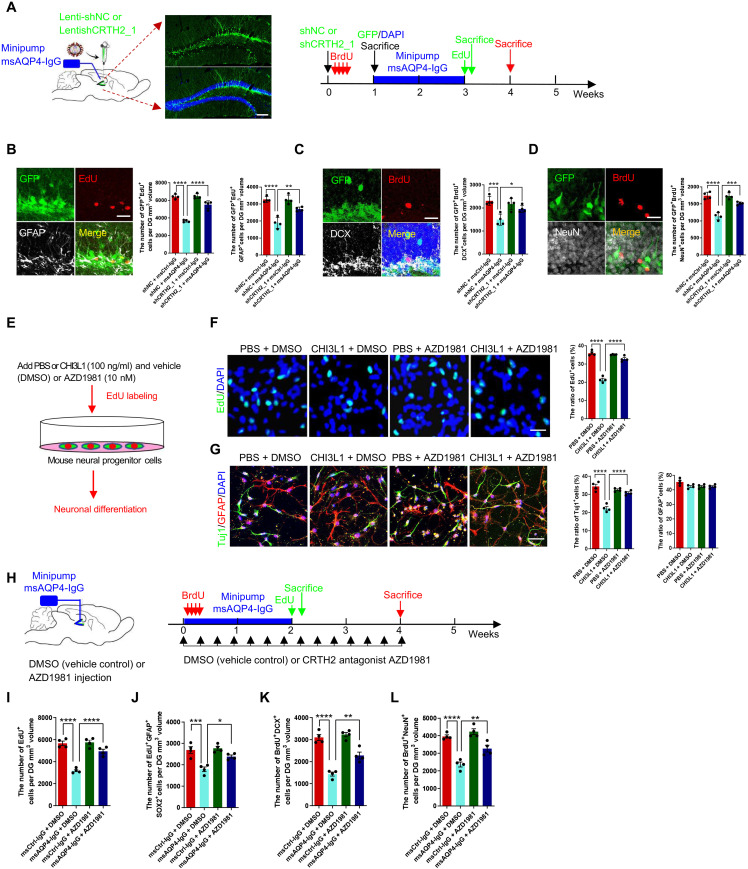
Fig. 7. The CRTH2 blockade effect on hippocampal neurogenesis and cognitive performance affected by CHI3L1.
(A) Schematic diagram of assays for shRNA-mediated CRTH2 knockdown effect on NSC proliferation and differentiation affected by msAQP4-IgG. The lentiviruses expressing GFP together with a scrambled nontargeting control shRNA (Lenti-shNC) or an shRNA targeting CRTH2 (Lenti-shCRTH2_1). Scale bars, 100 μm. (B) CRTH2 knockdown effect on NSC proliferation in DG, quantified by the numbers of proliferating cells expressing an shRNA (GFP+EdU+) and radial glia–like NSCs (GFP+EdU+GFAP). n = 4 animals. Scale bars, 20 μm. (C) Quantification of shRNA-expressing (GFP+) NSC (BrdU+) differentiation into immature neurons (DCX+) in DG. n = 4. Scale bars, 20 μm. (D) Quantification of NSC differentiation into mature neurons (GFP+BrdU+NeuN+) in DG. n = 4. Scale bars, 20 μm. (E) Schematic diagram of in vitro assays for the effect of AZD1981, a selective CRTH2 antagonist, on neurogenesis suppressed by CHI3L1 signaling secondary to mini-pump infusion of msCtrl-IgG or msAQP4-IgG. (F) Quantification of NSC proliferation in DG, in the presence of CHI3L1 or PBS and with AZD1981 or DMSO. n = 4. Scale bars, 100 μm. (G) Quantification of NSC neuronal differentiation. n = 4. Scale bars, 100 μm. (H) Schematic diagram of in vivo assays for AZD1981 efficacy to rescue neurogenesis affected by msAQP4-IgG–induced CHI3L1 signaling. (I and J) Quantification of NSC proliferation by computing total proliferating cells (EdU+) and radial glia–like NSCs (EdU+GFAP+Sox2+) in DG. n = 4. (K and L) Quantification of NSC proliferation into immature (BrdU+DCX+) and mature (BrdU+NeuN+) neurons. n = 4 animals. All quantitative data presented as bar graphs in means ± SEM and evaluated by one-way ANOVA and Tukey’s post hoc multiple comparisons. Nonsignificant comparisons are not identified. *P < 0.05, **P < 0.01, ***P < 0.001, ****P < 0.0001.

