FIGURE 9.

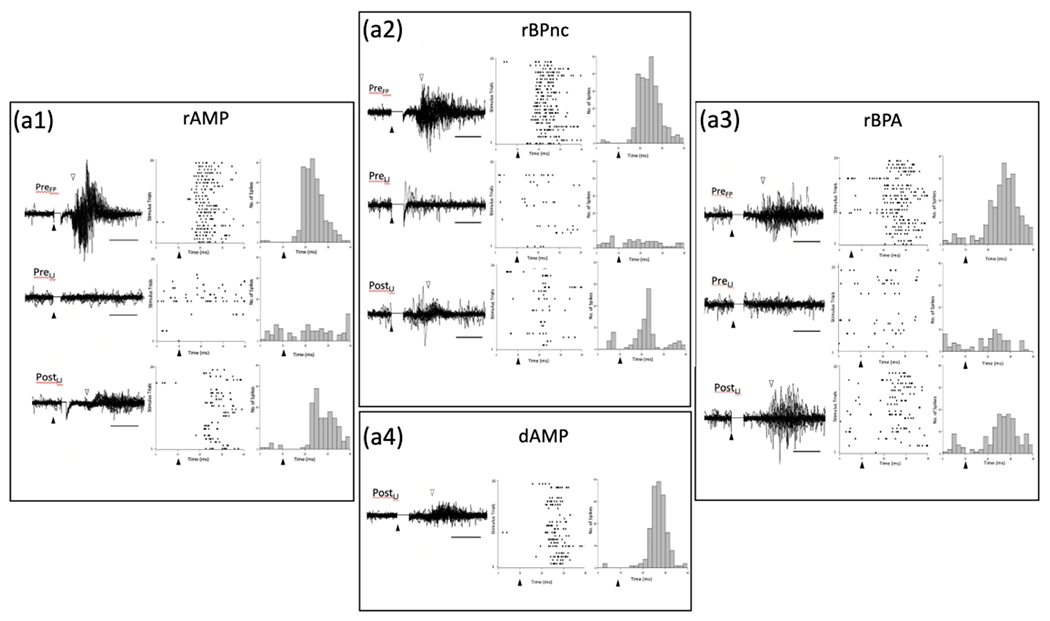
Representative examples of evoked response traces, raster plots, and post stimulus time histograms (PSTH) for each deafferentation group. (a1) rAMP group, Top row – Representative example of evoked response traces recorded in the FBS following 25 consecutive electrical simulations of the forepaw before deafferentation (PreFP). Solid triangles mark the time of stimulus onset, and open triangles mark the onset of the evoked response. Accompanying raster plots show cell firing for each stimulus trial, and PSTHs show the number spikes recorded in 2 ms bins. Middle row – Representative example of evoked responses recorded in the FBS following 25 consecutive stimulations of the lower jaw before deafferentation (PreLJ); accompanying raster and PSTH are also shown. Bottom Row – Representative example of evoked responses recorded in the FBS following 25 consecutive stimulations of the lower jaw along with accompanying raster plot and PSTH collected immediately after forelimb amputation. Note the presence of the evoked response following stimulation of the lower jaw which was not present prior to deafferentation. (a2, a3) Representative examples of evoked responses, raster plots and PSTHs for rBPnc and rBPA rats. In each case, lower jaw stimulation evoked a response in the FBS only after forelimb deafferentation. (a4) Representative example of evoked response traces, raster plot and PSTH for delayed forelimb amputee (dAMP) that was recorded 10-wks after amputation. dAMP rats were not tested prior to amputation. Inspection of each rapid deafferented group record shows that the onset of lower jaw evoked responses lagged behind PreFP recorded latencies. rAMP: rapid Amputation Group, rBPnc: rapid Brachial Plexus nerve cut Group, rBPA: rapid Brachial Plexus Anesthesia Group, dAMP: delayed Amputation Group.
