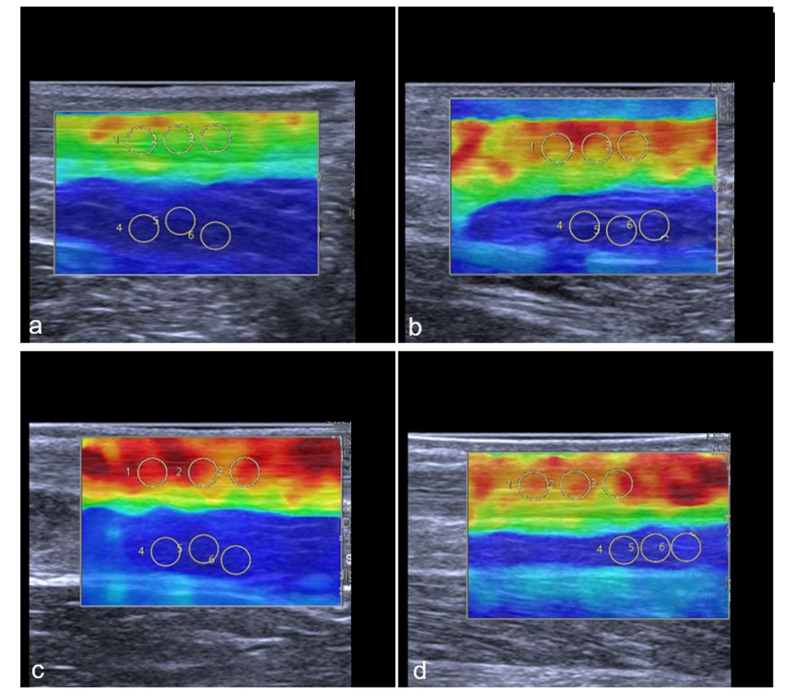
Figure 6.
Representative SWE images of two professional female athletes prior and after standardized treadmill. Color-coded map of Achilles tendon is shown in (a–d). Green corresponds with softer tendon tissue and lower SWS values. Subfigures (a–d) show the same female athlete, (a,c) demonstrate pre-exercise images. (b,d) demonstrate post-exercise images. The color-coded SWE maps in Figure 6 present the AT stiffness of two athletes. In the 2D-SWE color maps, red is coded as hard tissue and blue as soft. The overall SWS was calculated using four images with three regions per structure, given an overall number of 12 measurements per tendon or muscle. In this figure, a female athlete with lower baseline SWS (a) showed an increase in stiffness after exercise (b), while another athlete with higher baseline stiffness (c) showed a slight reduction in SWS (d) (Gastrocnemius muscle not shown in this images).

