Figure 3.
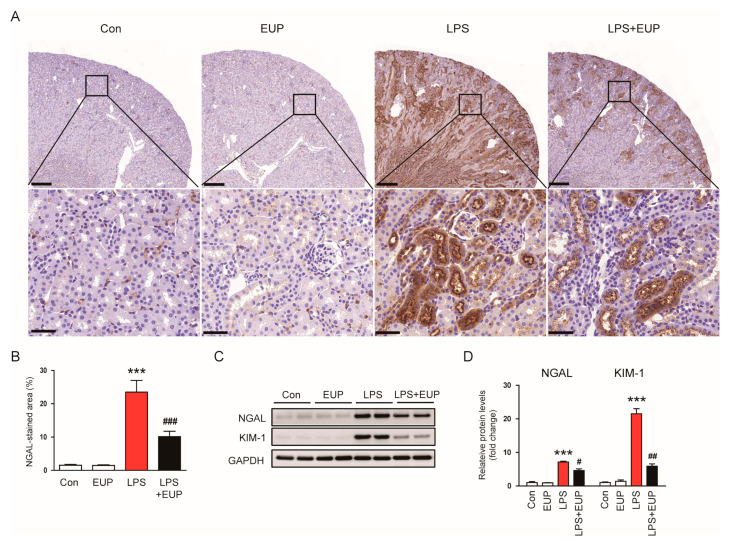
EUP decreased renal expression of NGAL and KIM-1. (A) IHC staining for NGAL. Scale bars: 250 μm (upper panel) and 40 μm (lower panel). (B) Percentage of the NGAL-stained area per field. (C) Western blotting of NGAL and KIM-1. (D) Relative band densities of NGAL and KIM-1. n = 8 per group. *** p < 0.001 vs. Con. # p < 0.05, ## p < 0.01 and ### p < 0.001 vs. LPS.

