
Figure 1. Enhancer landscape and topology of the PDGFRA locus in human gliomas and mouse neural/oligodendrocyte progenitors.
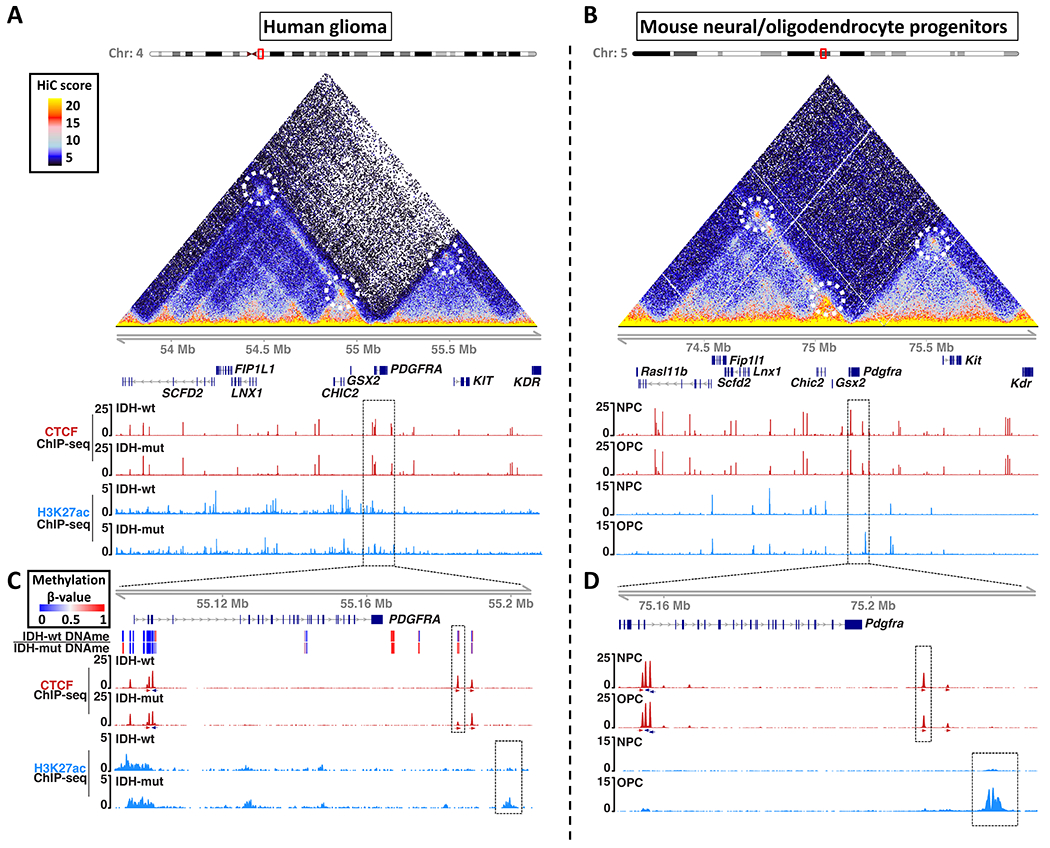
Maps of chromosome topology, CTCF insulator and enhancer-associated H3K27ac reveal synteny and conservation of the PDGFRA locus in (A) human and (B) mouse. HiC interaction maps (triangles) show pairwise contact frequencies in human IMR90 (left) and mouse NPCs (right). Chromatin loops are annotated with dashed circles. ChIP-seq tracks show CTCF (red) and H3K27ac (blue) in IDH1wt and IDH1mut human gliomas (A), and mouse NPCs and OPCs (B). Dashed boxes in (A) and (B) are expanded in (C) and (D) respectively. (C) Expanded genomic view shows DNA methylation (top heatmap), CTCF (red, orientation arrows below), and H3K27ac (blue) around the PDGFRA gene in human gliomas. The CTCF insulator disrupted in IDHmut gliomas (red peak in dashed box) corresponds to a boundary that shields PDGFRA from an enhancer (blue peak in dashed box). (D) Expanded genomic view shows the analogous CTCF site and enhancer in mouse progenitors. All ChIP-seq tracks are RPM normalized. These data (together with Figure S1) identify a conserved CTCF site that insulates PDGFRA from an OPC-specific enhancer, but is recurrently lost in IDH1mut gliomas.