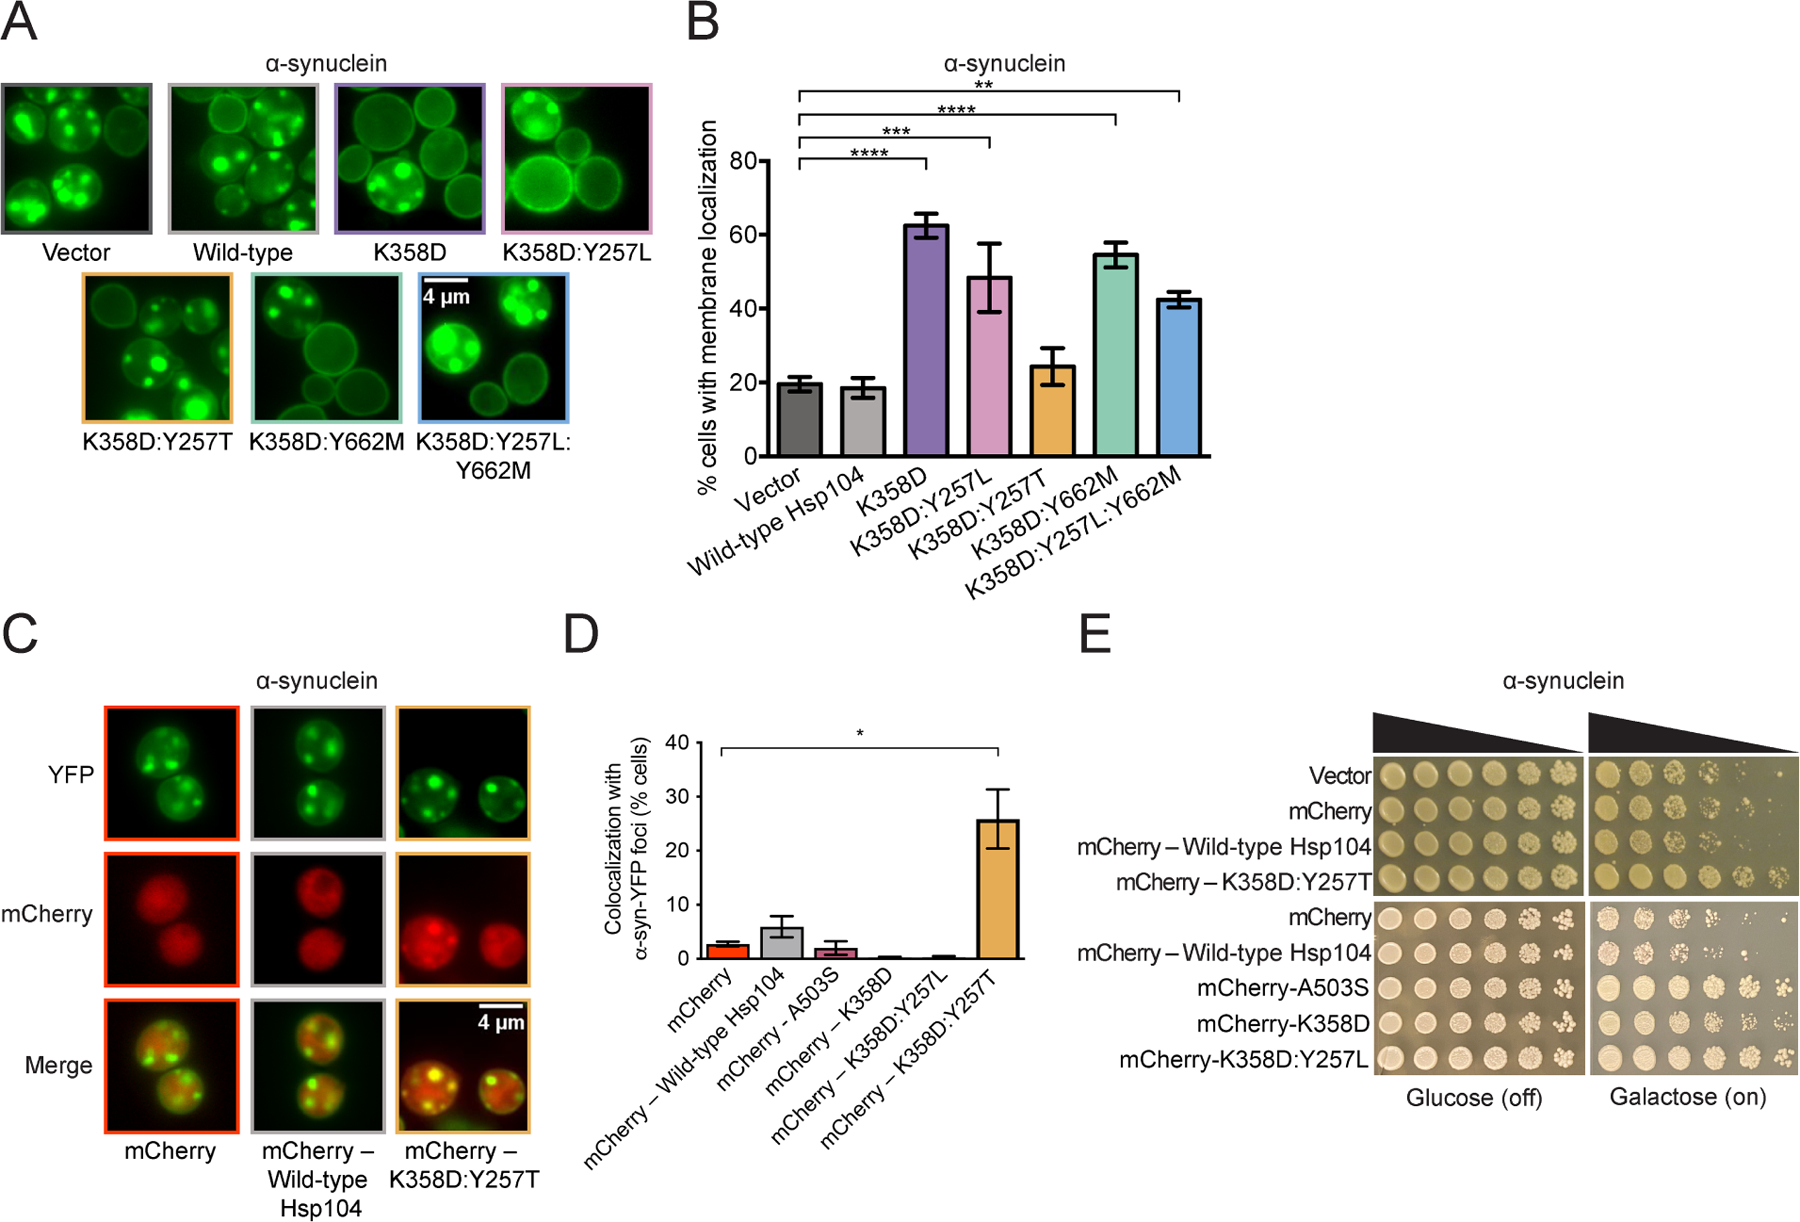
Figure 5. α-Syn-specific Hsp104 variants differentially eradicate α-syn inclusions.

(A) Representative fluorescence microscopy images of Δhsp104 yeast integrated with α-syn-YFP and transformed with Hsp104 variants or an empty vector control. Bar, 4µm. (B) Localization of α-syn-YFP in yeast was quantified by counting the number of cells with plasma membrane-localized α-syn-YFP or α-syn-YFP foci in the cytoplasm. Values represent means ± SEM (n = 3–6). **P<0.01, ***P<0.001, ****P<0.0001; One-way ANOVA with Dunnett’s post-hoc test. (C) Representative fluorescence microscopy images of Δhsp104 yeast integrated with α-syn-YFP and transformed with mCherry – Hsp104 variants or mCherry alone as a control. Bar, 4µm. (D) Colocalization of mCherry–Hsp104 variants or mCherry alone with α-syn-YFP foci was quantified. Values represent means ± SEM (n = 2–6). *P<0.05; One-way ANOVA with Dunnett’s post-hoc test. (E) Δhsp104 yeast integrated with α-syn-YFP on a galactose-inducible promoter were transformed with mCherry – Hsp104 variants or mCherry alone. Yeast were spotted onto glucose (uninducing, off) and galactose (inducing, on) media in a five-fold serial dilution.
See also Figure S5.
