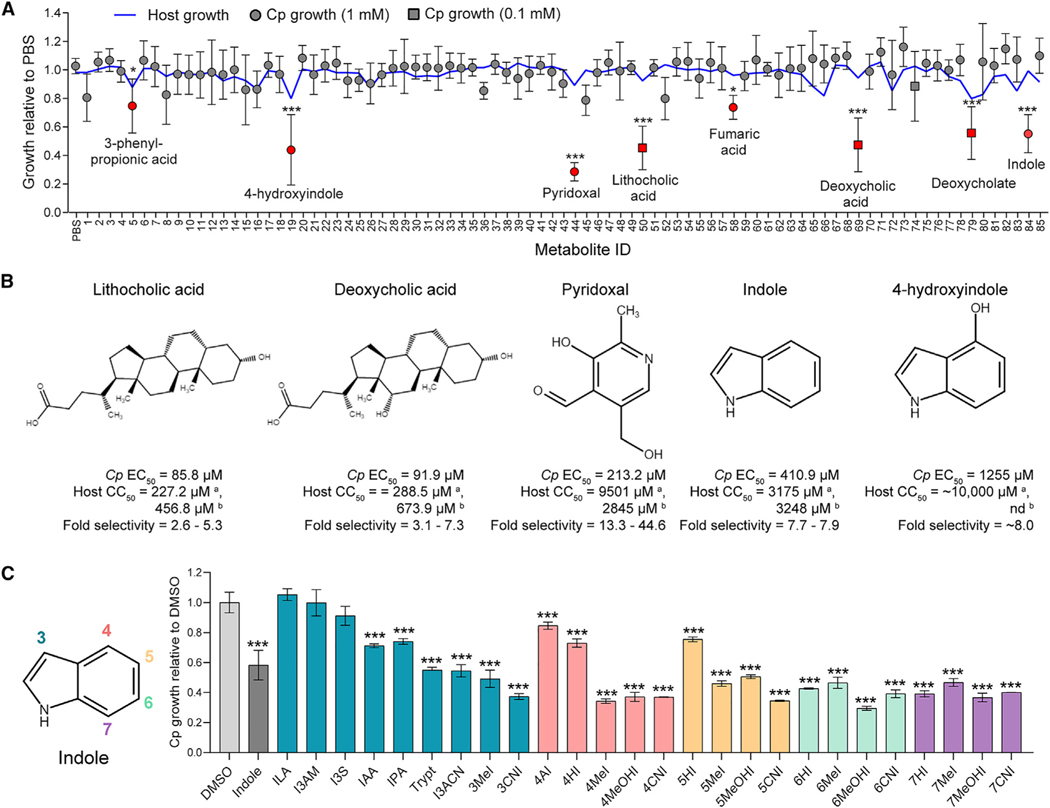
Figure 1. Gut metabolites, specifically secondary bile acids and indoles, inhibit C. parvum (Cp) infection in vitro.
(A) Effects of 85 intestinal metabolites at 1 mM (circles) or 0.1 mM (squares) on Cp infection in HCT-8 cells 24 hpi. Data plotted represent mean ± SD of Cp or mean host cell numbers (blue line) relative to PBS control for six independent experiments. Differences between Cp numbers for each metabolite and the PBS control were analyzed using a one-way ANOVA followed by Dunnett’s test for multiple comparisons. Metabolites that significantly inhibited Cp growth are indicated in red. *p < 0.05 and ***p < 0.001.
(B) Chemical structures of five inhibitory metabolites with their respective EC50 values for Cp and host cells and fold selectivity (host half maximal cytotoxic concentration [CC50] divided by Cp EC50). aHost CC50 values were calculated by counting Hoechst stained nuclei. CC50 values were calculated using a nonlinear regression curve fit with six replicates (three technical replicates from two independent experiments) per concentration. bHost CC50 values were calculated by Cell Titer-Glo Assay. nd, not done because of incompatibility with the assay. CC50 values were calculated using a nonlinear regression curve fit with nine replicates (three technical replicates from three independent experiments) per concentration.
(C) Screen of indole analogs (1 mM) modified at the 3-carbon (teal), 4-carbon (pink), 5-carbon (orange), 6-carbon (green), or 7-carbon (purple) positions and their effects on Cp infection in HCT-8 cells. Data plotted represent mean ± SD of six replicates (three technical replicates from two independent experiments). Differences between mean Cp numbers for each metabolite and the DMSO control were analyzed using a one-way ANOVA followed by Dunnett’s test for multiple comparisons. ***p < 0.001. ILA, indole-3-lactic acid; I3AM, indole-3-acetamide; I3S, indoxyl-3-sulfate; IAA, indole-3-acetic acid; IPA, indole-3-propionic acid; Trypt, tryptamine; I3ACN, indole-3-acetonitrile; MeI, methylindole; CNI, cyanoindole; AI, aminoindole; HI, hydroxyindole; MeOHI, methoxyindole.

