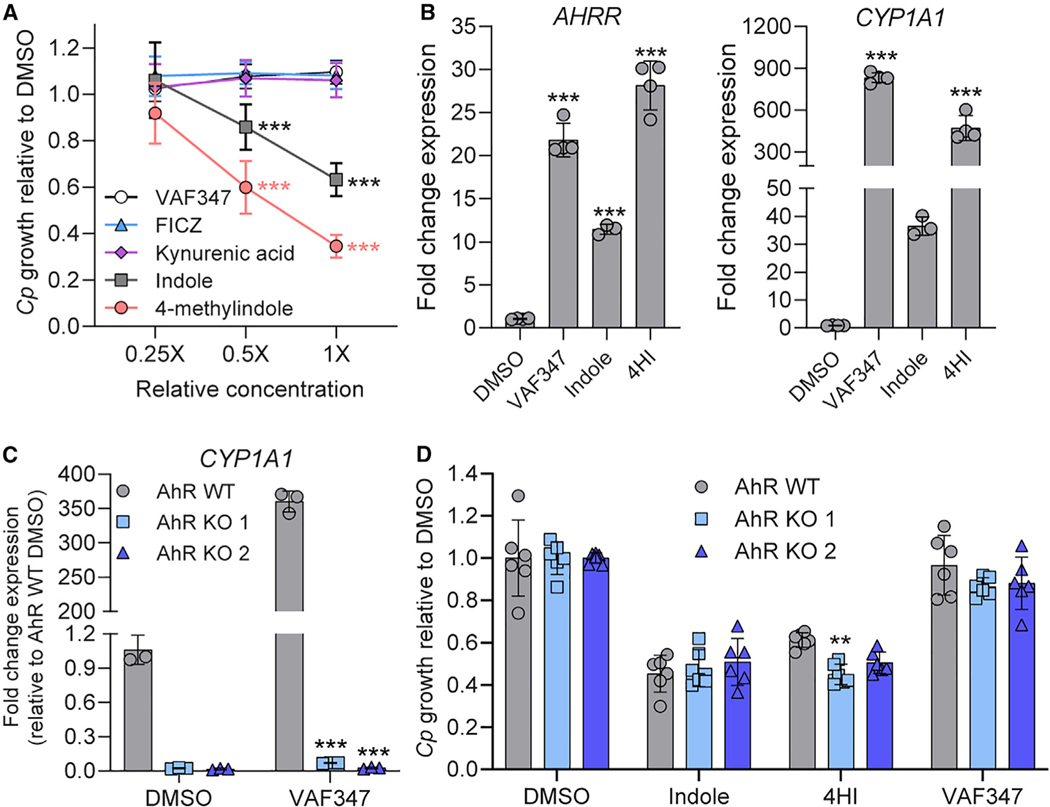
Figure 2. Indoles do not inhibit C. parvum (Cp) through the host AhR pathway.
(A) Ratio of Cp relative to DMSO control in HCT-8 cells after 24 h treatment with serial dilutions of AhR agonists. Starting concentrations (1×) were 1 μM for VAF347 and FICZ and 1 mM for kynurenic acid, indole, and 4-methylindole. Data plotted represent mean ± SD of nine replicates (three technical replicates from three independent experiments). Differences between mean Cp ratio in 1×- or 0.5×-treated cultures versus 0.25×-treated cultures for each compound were analyzed using a two-way ANOVA followed by Dunnett’s test for multiple comparisons. ***p < 0.001.
(B) Fold change in gene expression of human AHRR or CYP1A1 genes (normalized to GAPDH) in uninfected HCT-8 cultures after 24 h treatment with VAF347 (250 nM), indole (1.5 mM), or 4-hydroxyindole (4HI; 2.5 mM) relative to 1% DMSO control. Data plotted represent mean ± SD of 3 or 4 technical replicates from a single experiment. For each gene, differences between fold change in gene expression for each treatment versus DMSO control were analyzed using a one-way ANOVA followed by Dunnett’s test for multiple comparisons. ***p < 0.001.
(C) Fold change in gene expression of human CYP1A1 genes (normalized to GAPDH) in uninfected HCT-8 AhR WT (gray) or KO cell lines (blue) after 24 h treatment with VAF347 (500 nM) relative to 1% DMSO control. Data plotted represent mean ± SD of three technical replicates from a single experiment. Differences between fold change in gene expression for each AhR KO versus AhR WT cell line for each treatment were analyzed using a two-way ANOVA followed by Dunnett’s test for multiple comparisons. ***p < 0.001.
(D) Ratio of Cp relative to DMSO control in HCT-8 AhR WT (gray) or KO cell lines (blue) after 24 h treatment with 0.5% DMSO, indole (1 mM), 4HI (1 mM), or VAF347 (500 nM). Data plotted represent mean ± SD of six replicates (three technical replicates from two independent experiments). Differences between Cp ratio in each AhR KO versus AhR WT cell line for each treatment were analyzed using a two-way ANOVA followed by Dunnett’s test for multiple comparisons. **p < 0.01.
See also Figure S1.

