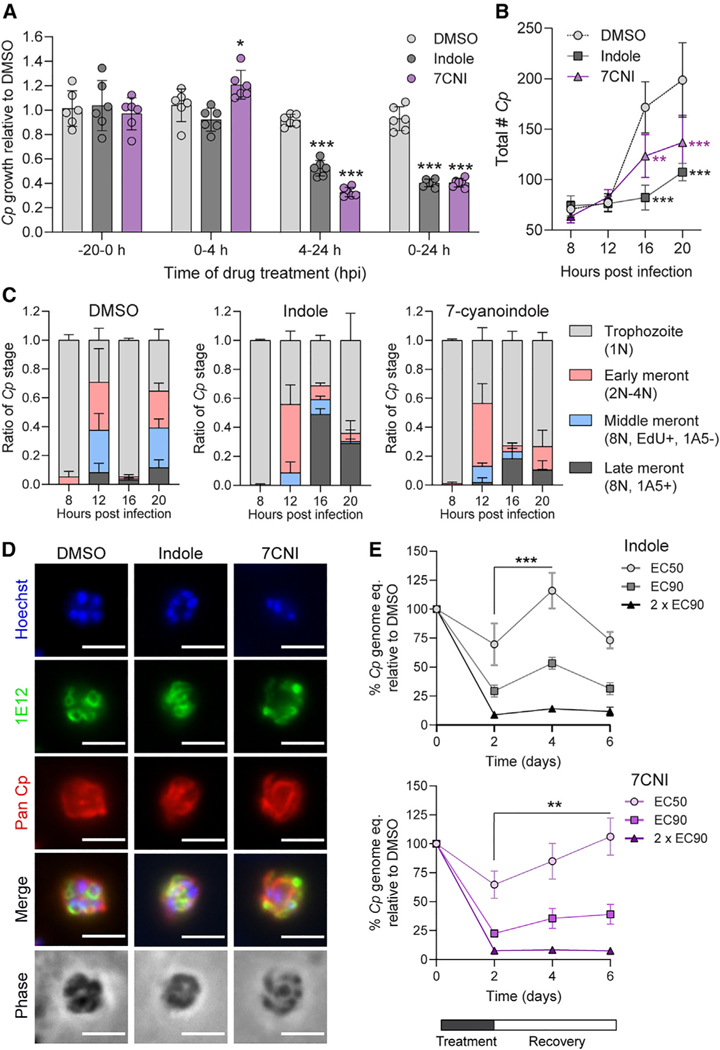
Figure 3. Indoles delay C. parvum (Cp) life cycle progression.
(A) Ratio of Cp numbers relative to DMSO control in HCT-8 cells after treatment with 1% DMSO or EC90 concentrations of indole (880 μM) or 7-cyanoindole (7CNI; 500 μM) for the indicated hours post-infection (hpi). Data plotted represent mean ± SD of six replicates (three technical replicates from two independent experiments). Differences between mean Cp ratio in indole or 7CNI-treated cultures vs in the DMSO control at each time point were analyzed using a two-way ANOVA followed by Dunnett’s test for multiple comparisons. *p < 0.05 and ***p < 0.001.
(B) Total number of Cp in HCT-8 cultures treated with 1% DMSO or EC90 concentrations of indole or 7CNI for the indicated hours post-infection. Data plotted represent mean ± SD of three independent experiments (same experiments as in C). Differences between mean Cp numbers in indole or 7CNI-treated cultures vs in the DMSO control at each time point were analyzed using a two-way ANOVA followed by Dunnett’s test for multiple comparisons. **p < 0.01 and ***p < 0.001.
(C) Ratio of the number of Cp in the trophozoite, early meront, middle meront, or late meront stages in infected HCT-8 cultures treated with 1% DMSO or EC90 concentrations of indole or 7CNI at the indicated hours post-infection. N, number of nuclei per parasite. Data plotted represent mean ± SD of three independent experiments.
(D) Immunofluorescence images of Cp in HCT-8 cultures treated with 1% DMSO or EC90 concentrations of indole or 7CNI 22 hpi. Parasites are labeled with membrane marker 1E12 (green) and a general Cp antibody, Pan Cp (red). Nuclei are stained with Hoechst. Scale bar, 3 μm.
(E) Washout experiments in Cp-infected air-liquid interface (ALI) cultures treated with 1% DMSO or indole at EC50 (577 μM), EC90 (1,894 μM), or 2 × EC90 (3,788 μM) or 7CNI at EC50 (379 μM), EC90 (688 μM), or 2 × EC90 (1,376 mM) for 48 h before washout. Cp genome equivalents were normalized to the DMSO control at each time point. Data plotted represent mean ± SD of six replicates (three technical replicates from two independent experiments). Differences between mean percentage Cp after washout versus mean percentage Cp at time of washout (2 dpi) for each indole concentration were analyzed using a two-way ANOVA followed by Dunnett’s test for multiple comparisons. **p < 0.01 and ***p < 0.001.
See also Figures S2 and S3.

