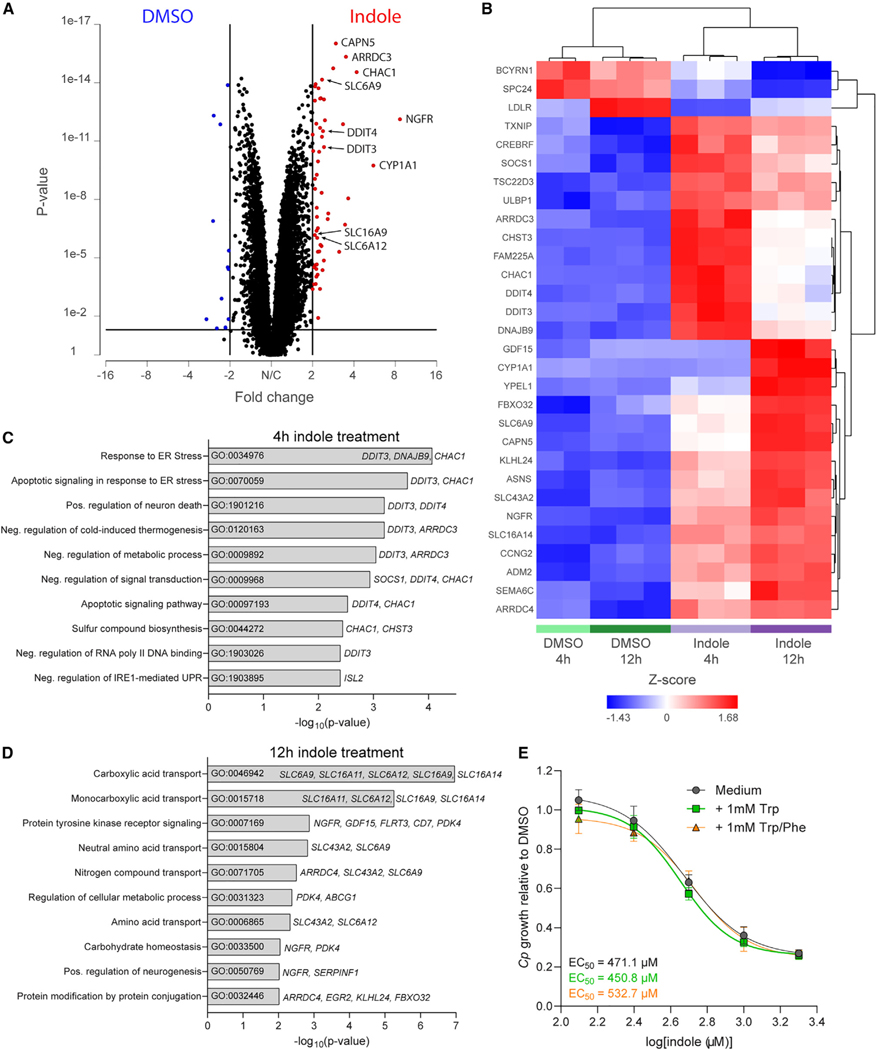
Figure 4. Indole induces ER stress and transporter upregulation in HCT-8 cells.
(A) Volcano plot of fold change vs p value after gene-specific analysis (GSA) of indole vs DMSO-treated HCT-8 cells highlighting genes significantly (p < 0.05) upregulated (red) or downregulated (blue) after indole treatment by >2-fold.
(B–D) Hierarchical clustering analysis of the 30 most differentially regulated genes (FDR-corrected p < 1 × 10⁻⁹) between indole and DMSO-treated HCT-8 cells. (C and D) Gene Ontology (GO) pathway analysis performed in Enrichr using genes significantly upregulated after (C) 4 h or (D) 12 h of indole treatment as input.
Upregulated genes associated with each pathway are listed to the right of the bar graph.
(E) Ratio of C. parvum (Cp) relative to DMSO control in HCT-8 cells after 24 h treatment with a serial dilution of indole in growth medium supplemented with 1 mM tryptophan (Trp) or 1 mM Trp plus 1 mM phenylalanine (PHE). EC50 values were calculated for each medium using a nonlinear regression curve fit with six replicates (three technical replicates from two independent experiments) per indole concentration.

