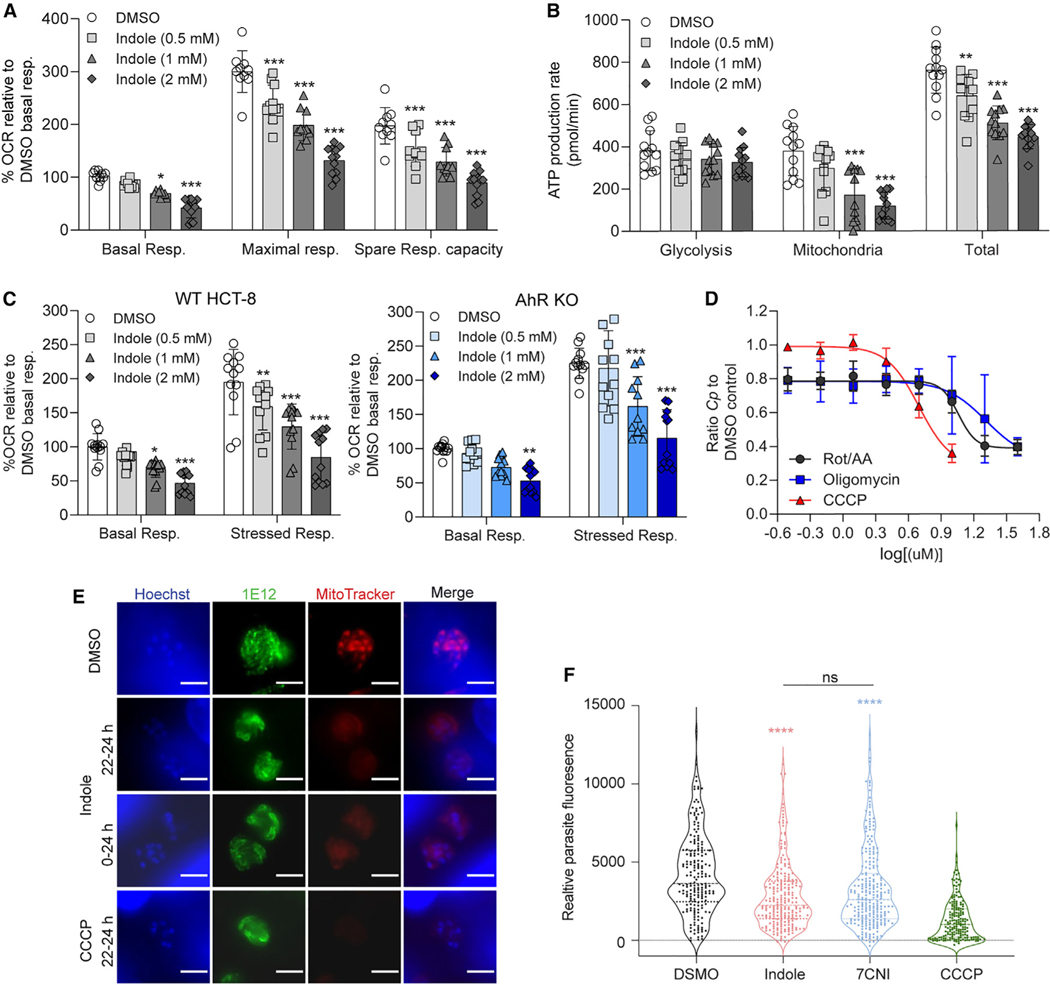
Figure 5. Indole impairs host mitochondrial ATP production and affects C. parvum (Cp) mitosome potential.
(A) Metabolic analysis using the Seahorse XF Cell Mito Stress Test kit on HCT-8 cells treated for 18 h with 1% DMSO or indole (0.5, 1, or 2 mM). Data calculated asa percentage of the oxygen consumption rate (OCR) for each well relative to the mean basal OCR of DMSO control cells for that experiment. Spare respiratory capacity = maximal respiratory rate - basal respiratory rate for each well. Data plotted represent mean ± SD of 12 replicates (six technical replicates from two independent experiments). Differences between percentage OCR for each indole concentration vs the DMSO control for each measurement were analyzed using a two-way ANOVA followed by Dunnett’s test for multiple comparisons. *p < 0.05 and ***p < 0.001.
(B) Metabolic analysis using the Seahorse XF Real-Time ATP Rate assay on HCT-8 cells treated for 18 h with 1% DMSO or indole (0.5, 1, or 2 mM). Data plotted represent mean ± SD of ATP production rate (pmol/min) produced by glycolysis, the mitochondria, or total ATP (glycolysis + mitochondrial ATP rates) for 12 replicates (six technical replicates from two independent experiments). For each source of ATP, differences between ATP production rate for each indole concentration vs the DMSO control were analyzed using a two-way ANOVA followed by Dunnett’s test for multiple comparisons. **p < 0.01 and ***p < 0.001.
(C) Metabolic analysis using the Seahorse XF Cell Energy Phenotype Test kit on HCT-8 AhR WT cells (gray) or AhR KO cells (blue) treated for 18 h with 1% DMSO or indole (0.5, 1, or 2 mM). Data calculated as a percentage of OCR for each well relative to the mean basal OCR of DMSO control cells for that experiment. Data plotted represent mean ± SD of 12 replicates (six technical replicates from two independent experiments). For each cell line, differences between percentage OCR for each indole concentration vs the DMSO control were analyzed using a one-way ANOVA followed by Dunnett’s test for multiple comparisons. *p < 0.05, **p < 0.01, and ***p < 0.001.
(D) Ratio of Cp relative to DMSO control in HCT-8 cells after 24 h treatment with serial dilutions of mitochondrial complex I and III inhibitors rotenone and antimycin A, respectively (Rot/AA); ATP synthase inhibitor oligomycin; or proton gradient uncoupler carbonyl cyanide m-chlorophenyl hydrazone (CCCP). Inhibition curves were calculated for each compound using a nonlinear regression curve fit with six replicates (three technical replicates from two independent experiments) per concentration.
(E) Immunofluorescence images of Cp in HCT-8 cultures treated with 1% DMSO or 2 × EC90 concentrations of indole (1.76 mM) or 10 μM CCCP for the indicated hours post-infection. Parasites were labeled with membrane marker 1E12 (green), MitoTracker Red CMXRos (red), and nuclei were stained with Hoechst (blue). Scale bar, 3 μm.
(F) Distribution of MitoTracker intensity for indole-treated parasites. Cp in HCT-8 cultures treated with 1% DMSO or 2 × EC90 concentrations of indole (1.76 mM), 7-cyanoindole (7CNI) (1 mM), or 10 μM CCCP for 2 h starting 22 hpi. Parasite fluorescence intensity was measured on the basis of MitoTracker staining collected from at least 180 parasites from two independent experiments. Statistical analyses comparing each treatment group with control were performed using two-tailed Mann-Whitney U tests. ****p < 0.0001. ns, not significant. (DMSO compared with indole shown in red asterisk, DMSO compared with 7CNI shown in blue asterisk.).
See also Figure S4.

