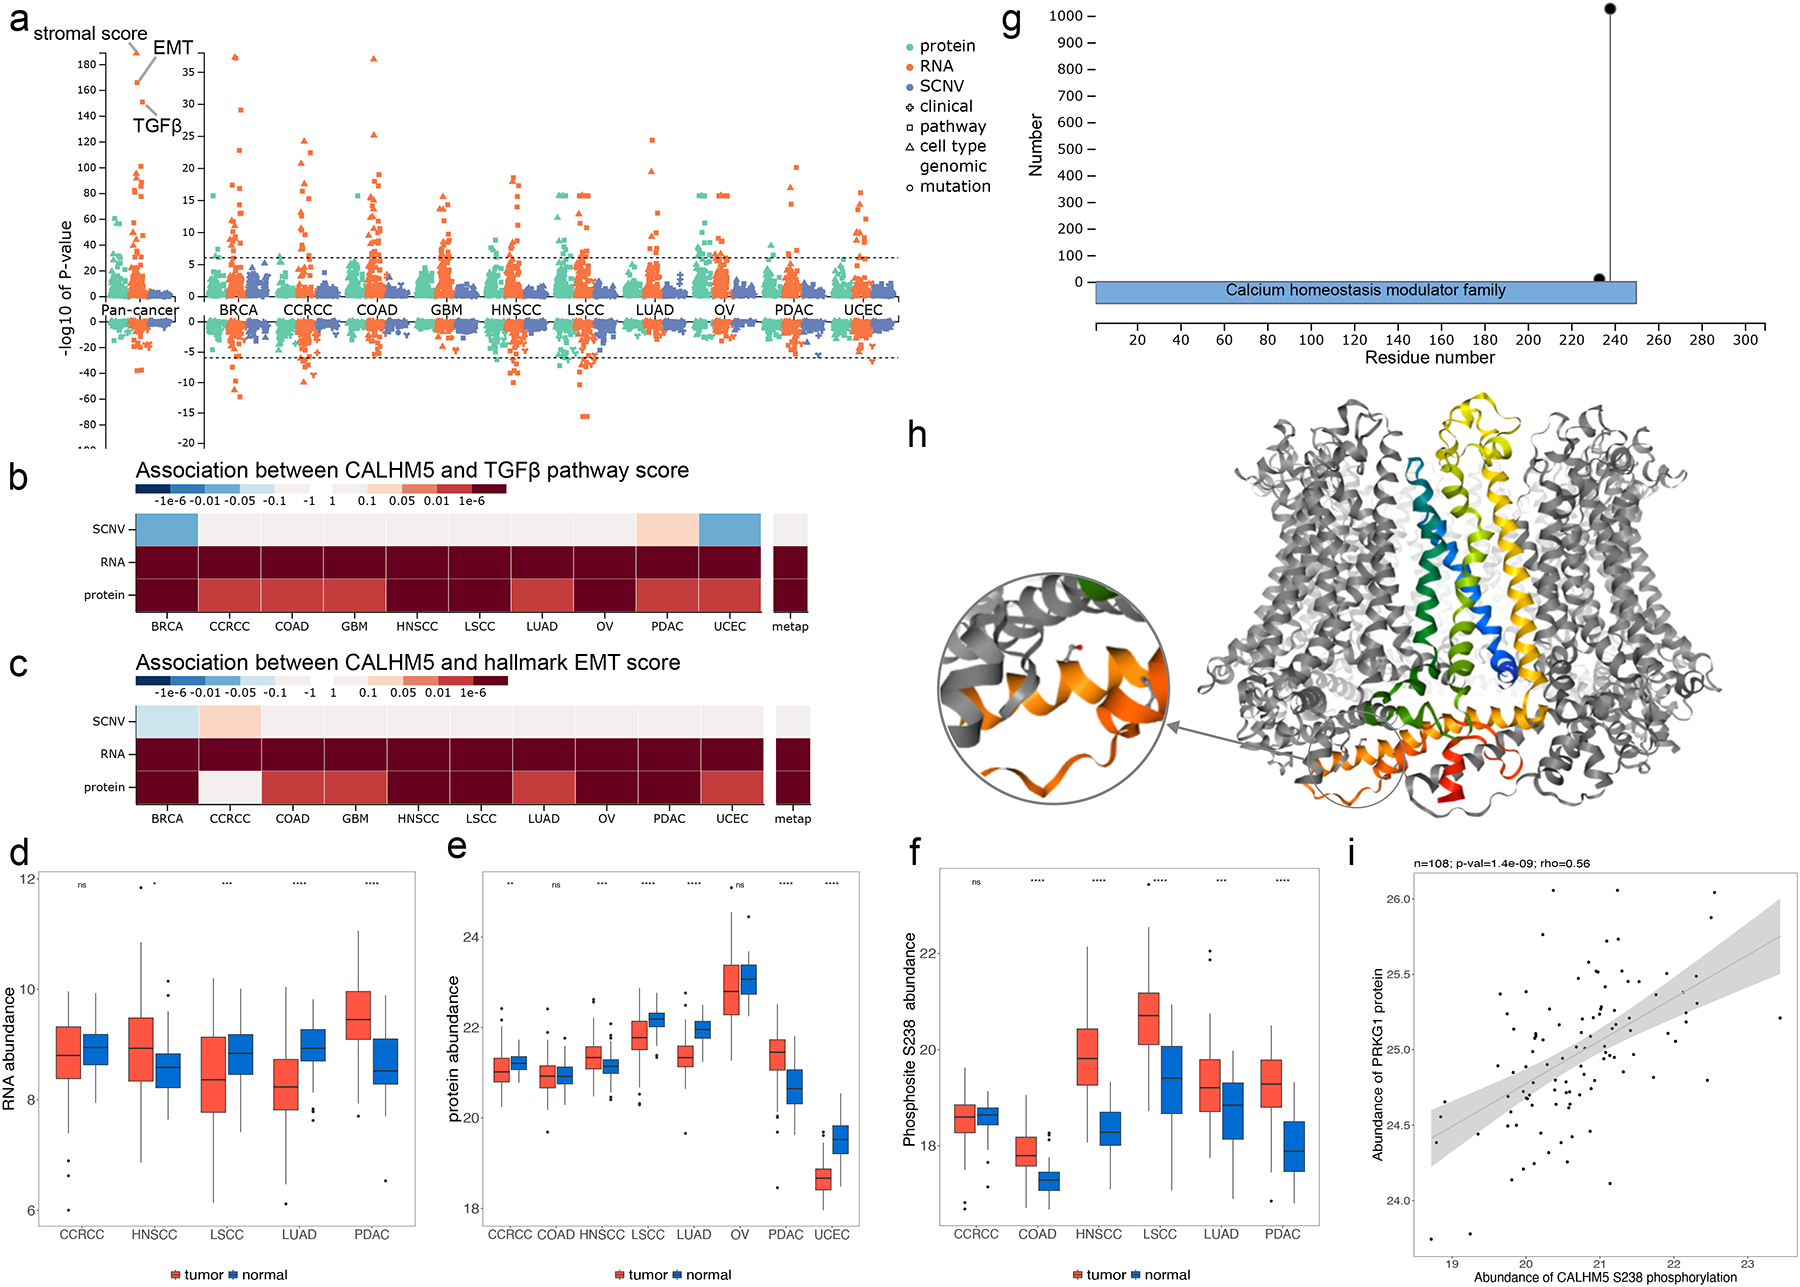
Figure 3. Proteogenomics insights into CALHM5.

(a) Manhattan plot showing p-values of phenotype and mutation associations of CALHM5 at copy number, mRNA, and protein levels, respectively. The stroma, TGFbeta and epithelial-mesenchymal transition (EMT) scores are labeled in pan-cancer analysis at the mRNA level. (b) P-value heatmap summary of CALHM5 associations with the TGFbeta perturbation signature score computed by the PROGENy algorithm. (c) P-value heatmap summary of CALHM5 associations with the EMT pathway activity score computed by applying single sample gene set enrichment analysis (ssGSEA) to MSigDB Hallmark gene sets. (d) Boxplots depicting tumor and NAT difference of RNA data. (e) Boxplots depicting tumor and NAT difference of protein data. (f) Tumor and NAT difference of CALHM5 S238 phosphosite abundance. S238 phosphorylation abundance is significantly higher in LSCC and LUAD tumors despite significantly decreased mRNA and protein level shown in d and e. (g) Lollipop plot showing phosphosite S328 with high occurrence in samples and its sequence domain location. (h) Experimental structure of the CALHM5 homo-oligomer forming a channel with S238 highlighted (PDB: 7D60). (i) Kinase PRKG1 protein level is significantly positively correlated with S238 in LSCC with a Spearman correlation coefficient of 0.56 and p-value of 1.4e-9. ns: p ≥ 0.05; *p < 0.05; **p< 0.01; ***p < 0.001; ****p < 0.0001.
