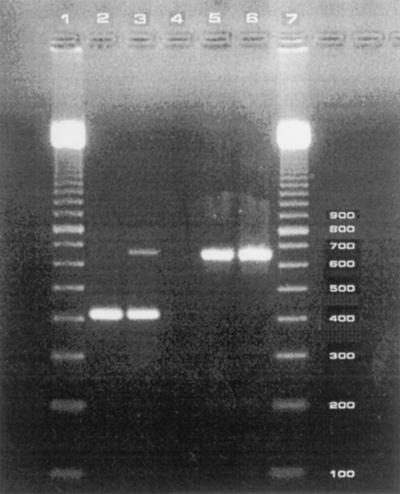
FIG. 1.
Electrophoretic analysis of amplicons obtained by PCR with species-specific primers U5 and U4. Lower band (429 bp), specific for U. urealyticum; higher band (657 bp), internal process control. Lane 1, 100-bp marker; lane 2, positive sample lacking the internal process control; lane 3, positive sample with the internal process control; lane 4, inhibitory sample; lane 5, negative sample; lane 6, negative sample (water); lane 7, 100-bp marker.

