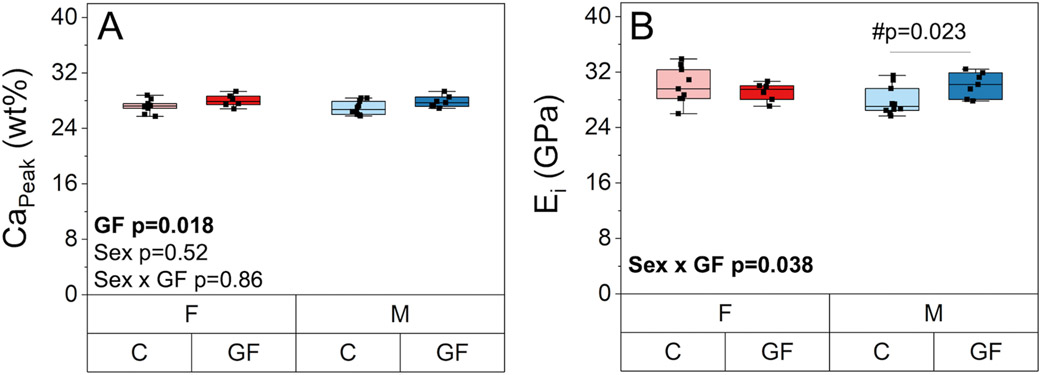
Figure 9.
The effect of GF and sex on tissue scale material properties. A) CaPeak from qBEI was slightly higher with GF but was not affected by sex. B) Nanoindentation modulus (Ei) was increased in GF males and was unchanged in GF females compared to their respective conventional groups. Boxplots represent median value (cross), interquartile range (box), minimum/maximum (whiskers), and symbols representing all data points. All p-values correspond with results of the omnibus ANOVA test, unless specifically indicated with symbol # which indicates a pairwise post-hoc test following a significant interaction.

