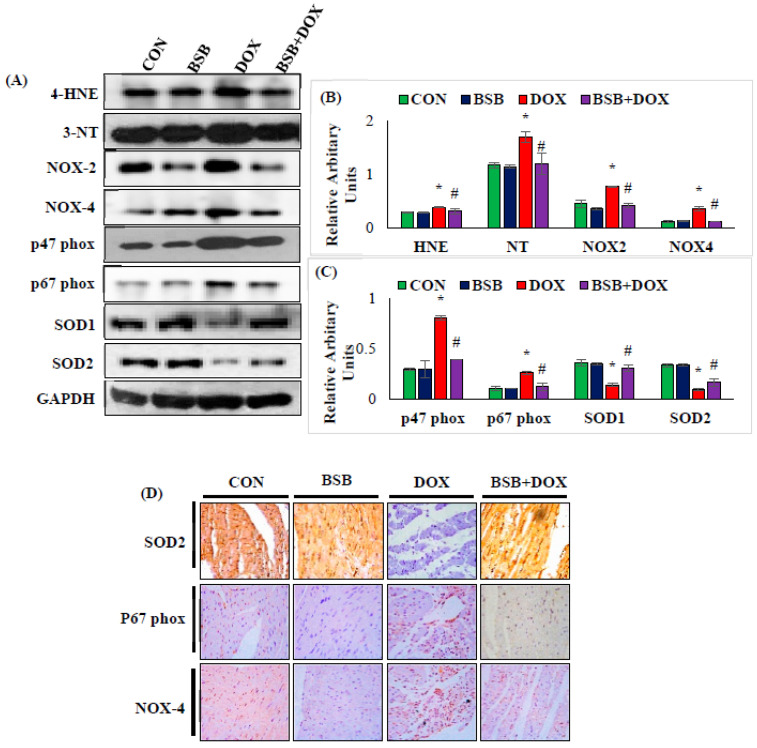
Figure 2.
Immunoblotting of oxidative stress markers (A), densitometric analysis and changes in expression of HNE, 3-NT, NOX2 and 4, p47 phox, p67 phox, SOD1 and 2 (B,C), immunohistochemical analysis of SOD2, p67 phox and NOX4, magnification (40×) (D). Columns not sharing a common symbol (*, #) differ significantly from each other (* p < 0.05 vs. normal control, # p < 0.05 vs. DOX control). Immunoblotting and immunohistochemical analysis were performed in duplicates. CON: Normal control rats; BSB: α-Bisabolol-alone-treated rats; DOX: DOX-alone-treated rats; BSB + DOX: α-Bisabolol-and-DOX-treated-rats.

