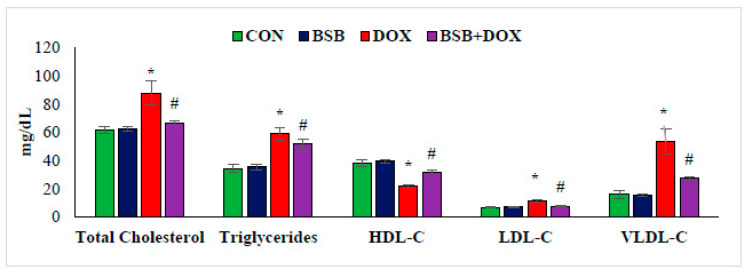
Figure 7.
The levels of lipids in the serum. Each column is mean ± SD for eight rats in each group; columns not sharing a common symbol (*, #) differ significantly from each other (* p < 0.05 vs. normal control, # p < 0.05 vs. DOX control). CON: Normal control rats; BSB: α-Bisabolol-alone-treated rats; DOX: DOX-alone-treated rats; BSB + DOX: α-Bisabolol-and-DOX-treated rats.

