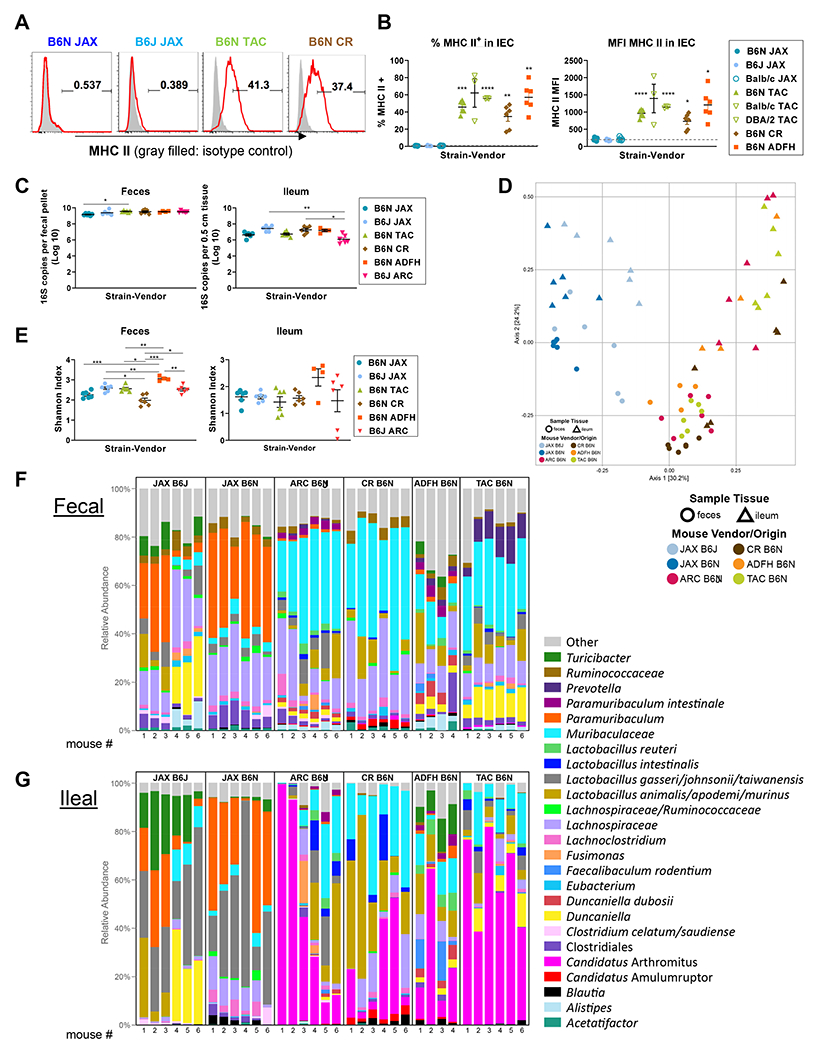
Figure 1. MHC II expression on intestinal epithelial cells (IEC) is dependent on intestinal microbiota rather than murine genetic variation.

(A, B) Naïve B6J, B6N, BALB/c and DBA/2 mice derived from different vendors were compared for MHC-II expression on ileal IEC. (A) Representative flow plots and (B) quantification of positivity and MFI for MHC-II on IEC. Data of BALB/c and DBA/2 from Taconic are from 1 experiment, n = 3 per group. Remaining data are combined from 2 experiments, n = 6 per group. Brown-Forsythe and Welch ANOVA test with Dunnett’s T3 multiple comparisons against B6N JAX. (C-G) Fecal and ileal samples were collected from naive JAX B6J, JAX B6N, Taconic B6N, CR B6N, ADFH B6N and ARC B6J mice and underwent 16S rRNA gene sequencing. All data are combined from two independent litters except ARC B6J which was from one (n = 4 – 6 per group). (C) The total bacterial load in fecal and ileal samples was compared by Kruskal-Wallis test with Dunn’s multiple comparison test. (D) Multi-dimensional scaling (MDS) plot using the Bray-Curtis dissimilarity metric was used to visualize the fecal and ileal microbiota of mice from different vendors. Each point represents the intestinal microbiota in a single sample. (E) Shannon index shown by Welch’s t-test with p-values adjusted using Holm’s method. (F-G) Relative abundance of the top 25 bacterial taxa detected in fecal (F) and (G) ileal samples. (B, C, E) Show mean ± SEM, *P < 0.05, **P < 0.01, ***P < 0.001, ****P < 0.0001.
