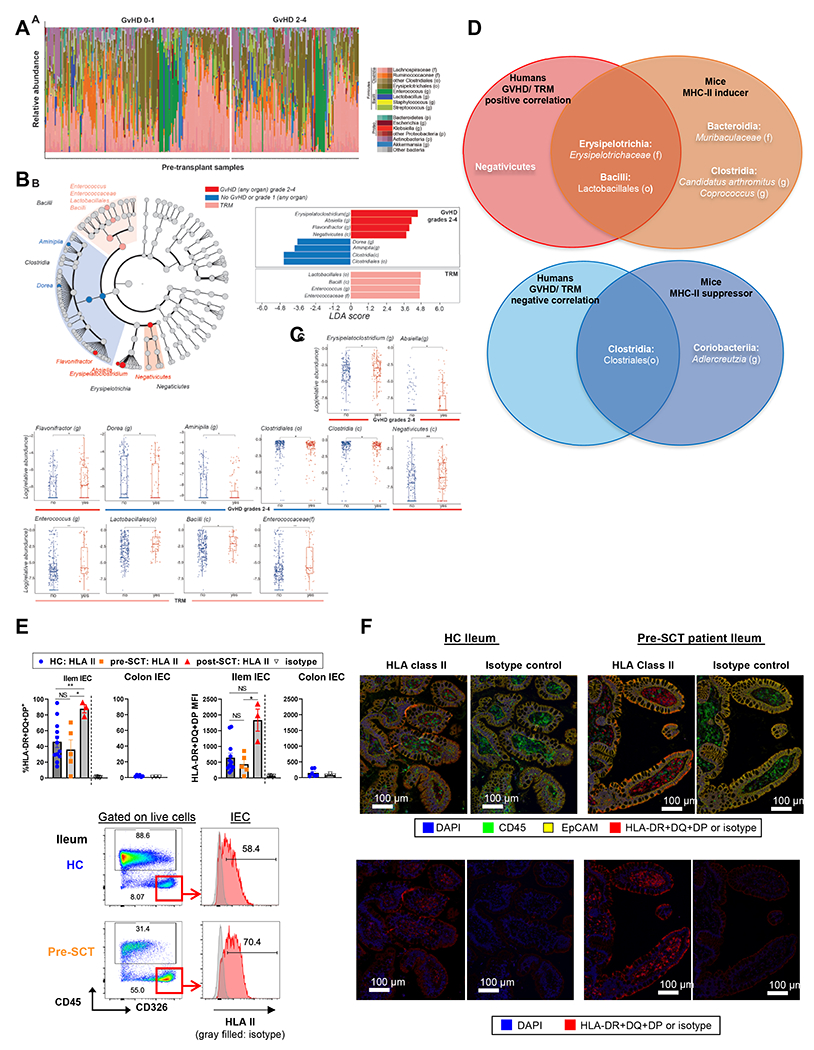
Figure 7. Pre-transplant Bacilli and Clostridia in stool correlate with grade 2-4 GVHD and TRM.

(A) Visualization of the composition of pre-HCT microbiota in 287 patients separated in patients who later develop GVHD grades 0-1 vs. 2-4. (B) LEfSe results are shown in a cladogram form (left) and bar plot (right). The cladogram illustrates the taxa associated with either TRM or GVHD grades 2-4 and their phylogenetic information. The bar plot illustrates the taxa and their LDA score. (C) Taxa-rank comparisons of patients who later develop GVHD grades 2-4 or not; and patients with TRM. The taxa were selected from LEfSe, as seen in panel (B). *p < 0.05, **p < 0.01. (D) Venn diagrams correlating inducers and suppressors across human and mouse. (E-F) Ileum and colon biopsies from healthy individuals and patients pre- or post-transplant were dissociated for flow cytometric analysis (E) or stained for immunofluorescent analysis (F). Representative flow plots with quantification of MFI and % HLA-II expression by IEC (E), and representative immunofluorescence images (F) are shown. (E) Ileum: n = 12, 5, 3 per healthy control (HC), pre-SCT, post-SCT. Colon: n = 6 per HC. Brown-Forsythe and Welch ANOVA test with Dunnett’s T3 multiple comparisons for % positivity of ileal HLA-II and Kruskal-Wallis test with Dunn’s multiple comparisons for ileal HLA-II MFI (mean ± SEM). (F) Ileum: n = 3, 3 per HC or pre-SCT. GVHD: graft versus host disease; TRM: transplant related mortality; LDA: linear discriminant analysis. NS: not significant. See also Figure S7, and Table S1–S3, S6.
