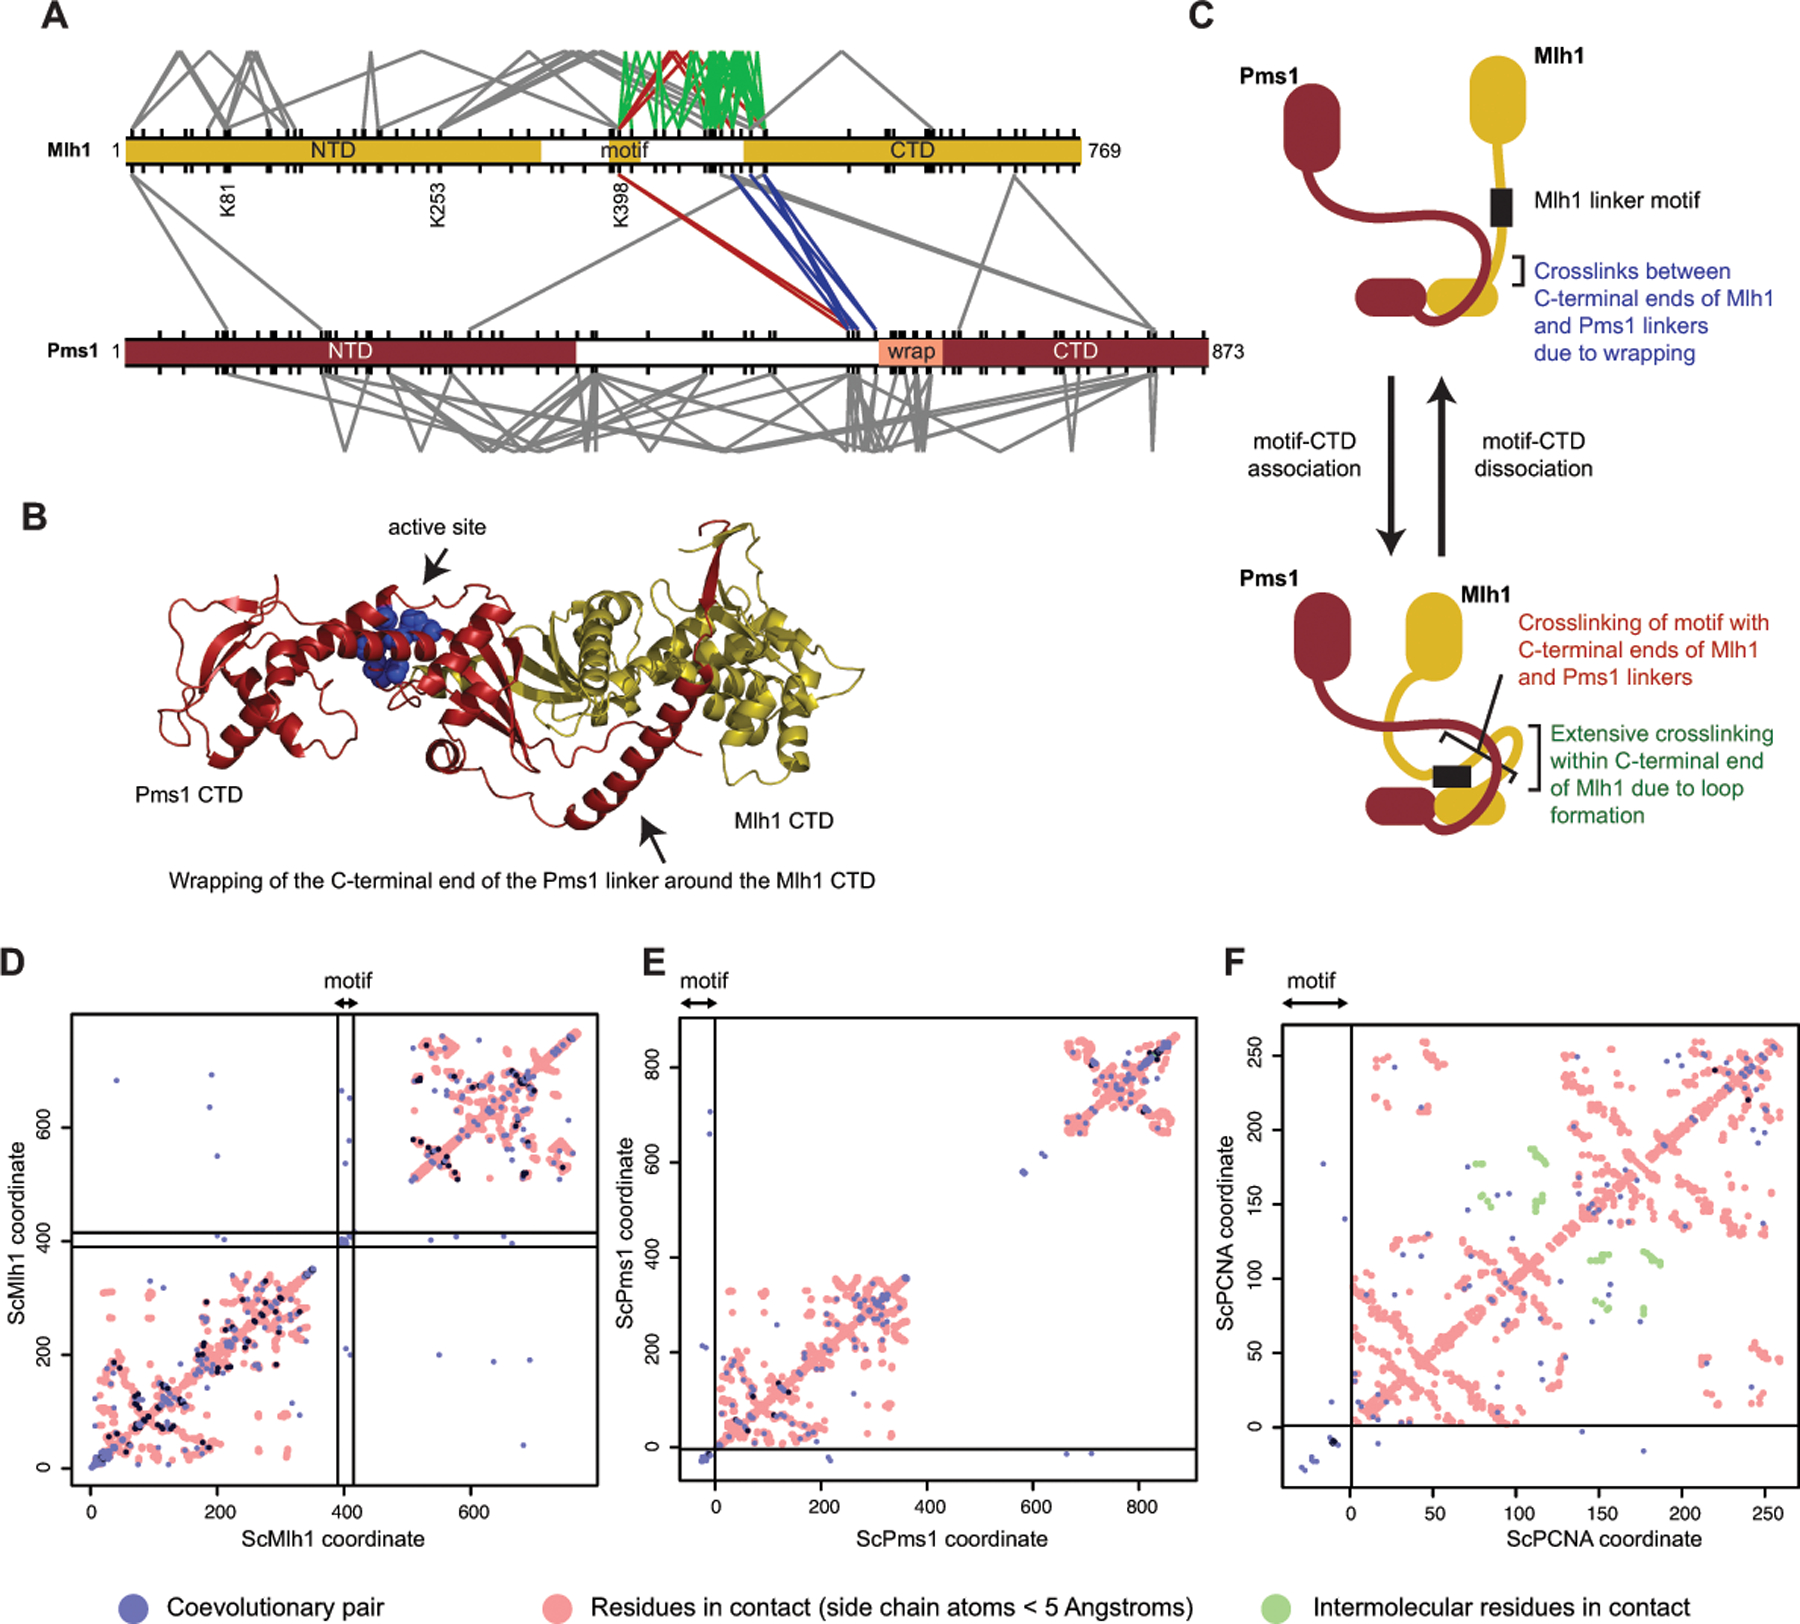
Figure 4. The conserved linker motif likely interacts with the CTD dimer near the active site.

A. Lysine crosslinks of S. cerevisiae Mlh1 (top) and Pms1 (bottom) in the absence of ATP and DNA[26] are depicted as V-shapes for intramolecular crosslinks and lines for intermolecular crosslinks. Red are crosslinks between the conserved linker motif and the Mlh1 and Pms1 CTDs; blue are crosslinks between the N-terminal ends of the Mlh1 and Pms1 CTDs; green are crosslinks within the C-terminal end of the Mlh1 linker. All lysines are shown as tic marks. B. Wrapping of the C-terminus of the Pms1 linker around the Mlh1 domain as predicted by Alphafold2[40] is consistent with crosslinking data (blue lines in panel A). C. A model consistent with many of the observed crosslinks that can be explained by Pms1 wrapping (blue lines in panel A), crosslinking of the motif to the CTD (red lines in panel A), and extensive crosslinking of lysines in the C-terminal half of the Mlh1 linker (green lines in panel A). D. Evolutionary coupling of residues in Mlh1 with GREMLIN[61]. Blue and dark blue points are evolutionary coupled sites; red points are side-chain contacts calculated from an Alphafold2 model of S. cerevisiae Mlh1-Pms1 [40]. Residues in the conserved motif are within the region demarked by black lines; off-diagonal points within these lines indicate coupling to motif residues. E. Evolutionary coupling of the Mlh1 linker motif placed at the beginning of the alignment (left and bottom of graph, separated by black lines) with Pms1. F. Evolutionary coupling of the Mlh1 motif with PCNA shown as for panel E; red and green points are intra- and intersubunit side-chain contacts in the S. cerevisiae PCNA trimer calculated from the PDB accession 1plq.
