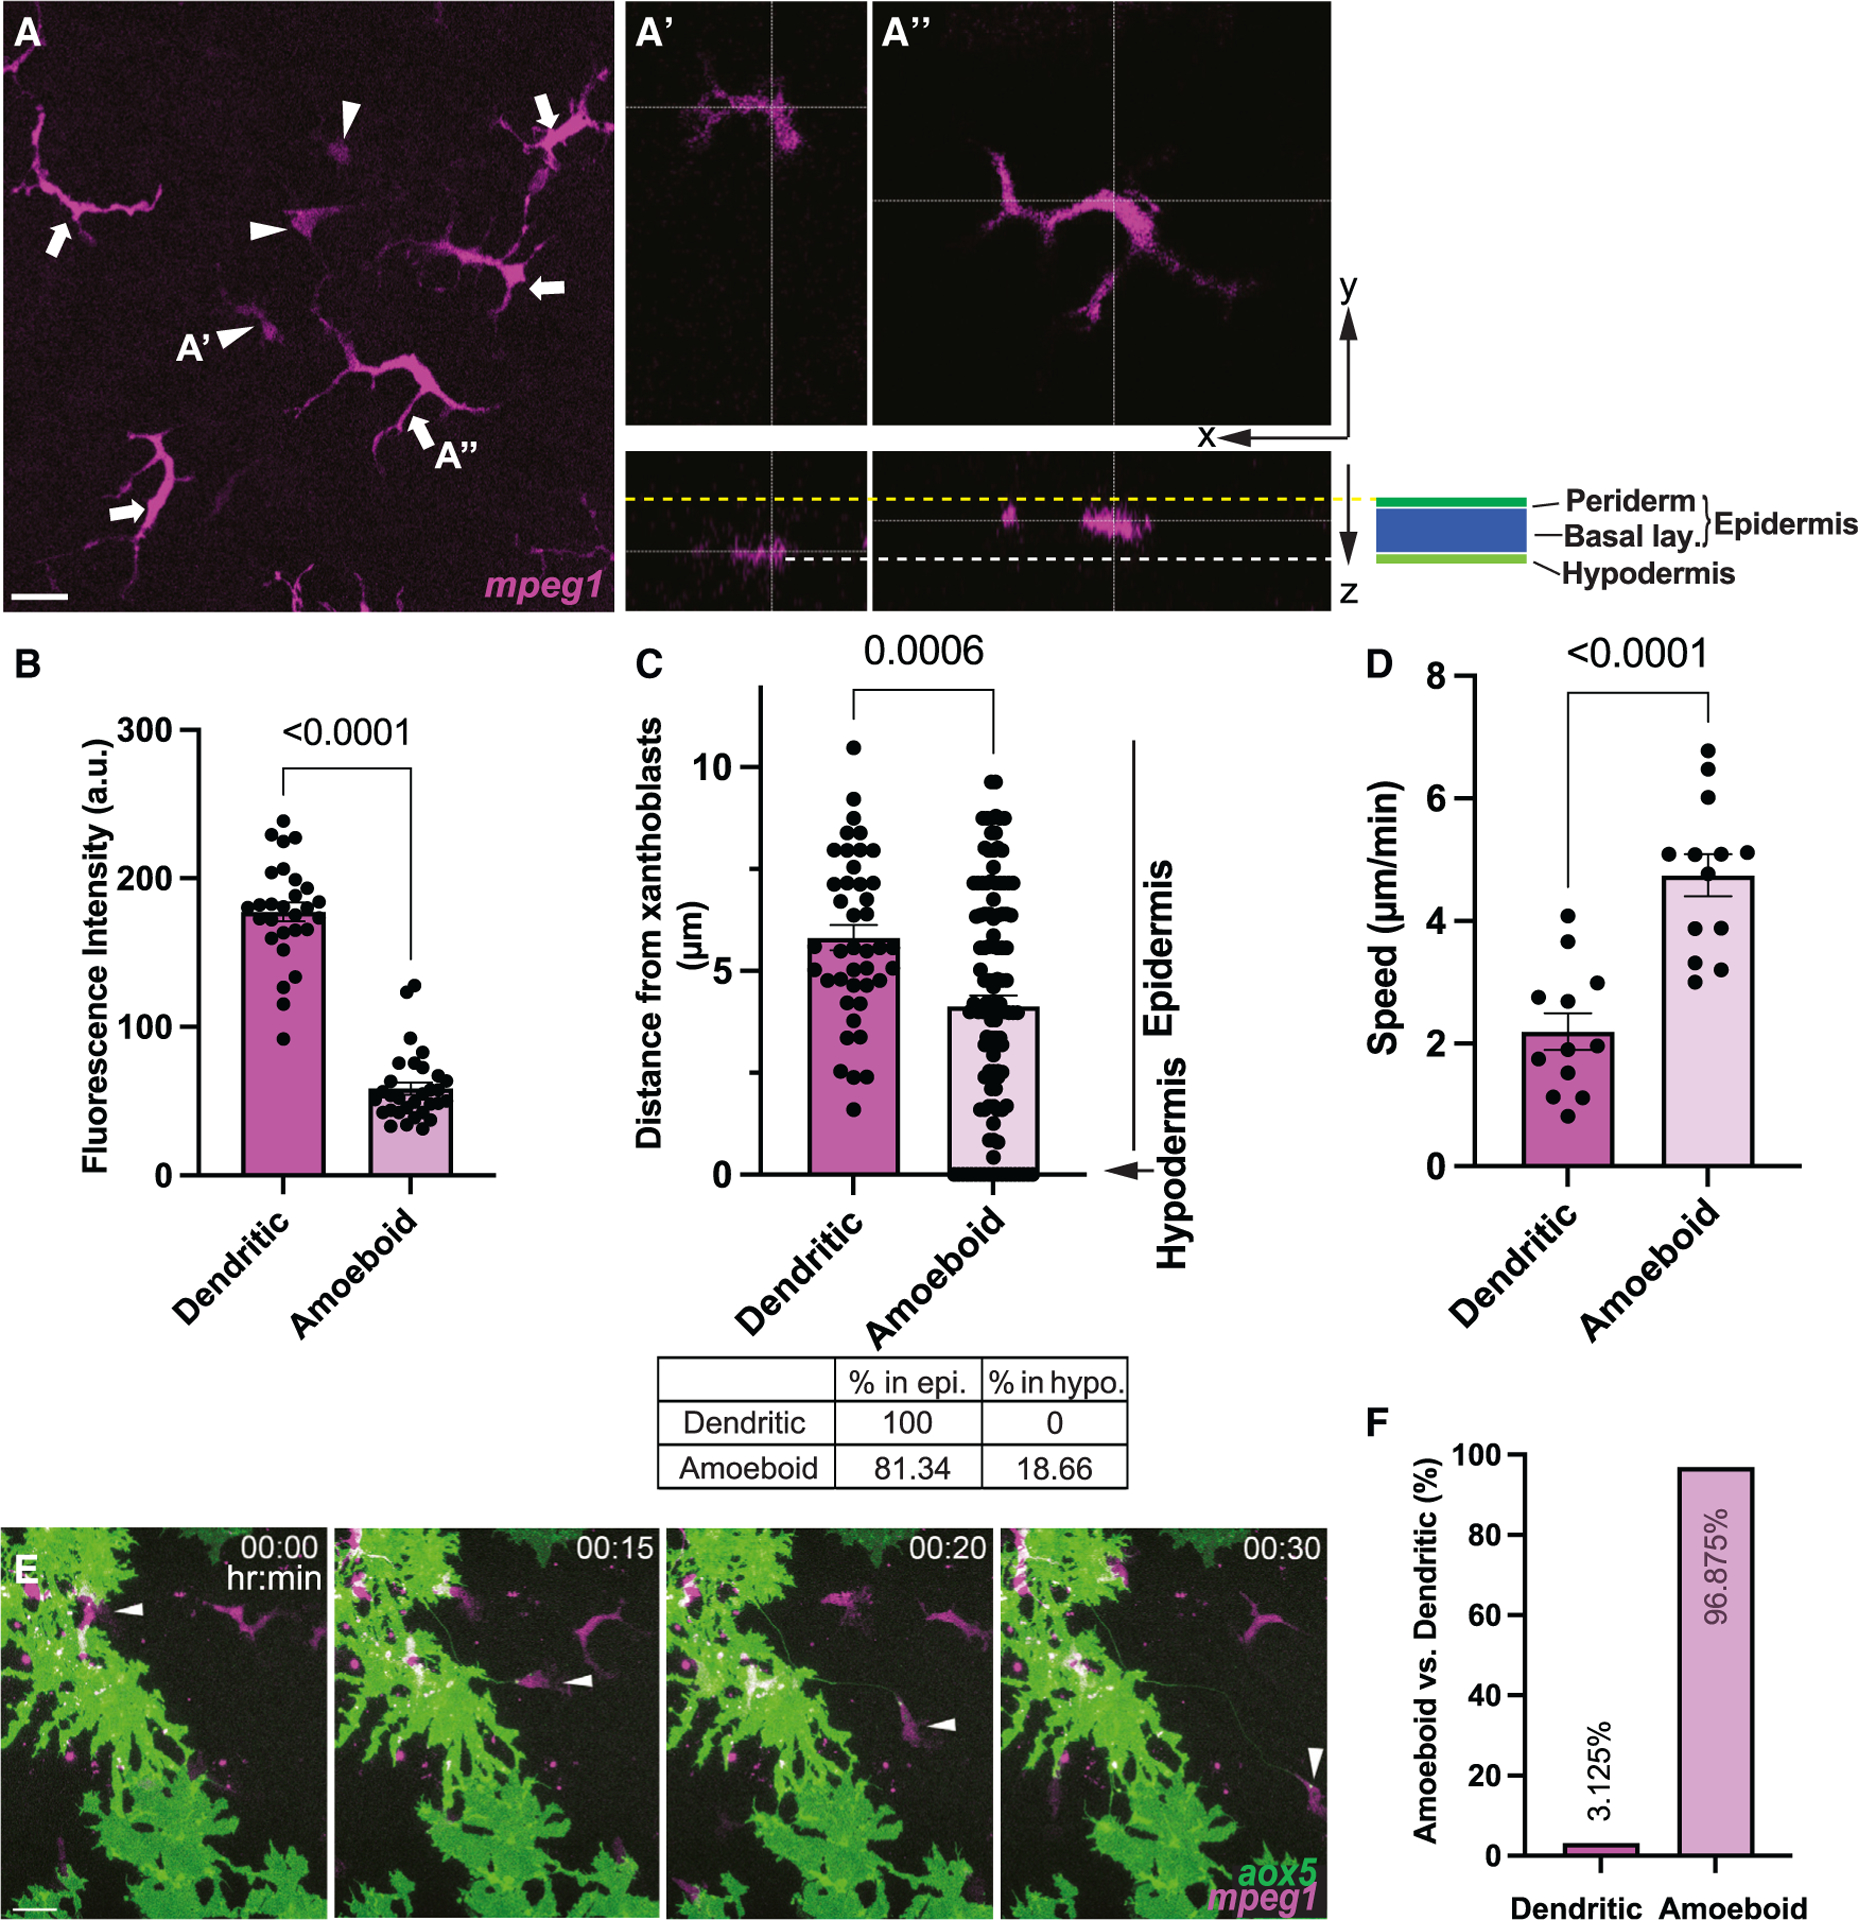
Figure 1. Two distinct macrophage subpopulations in zebrafish skin.

(A) mpeg1+ ameboid (arrowheads) and dendritic (arrows) macrophages shown in maximum projection image. (A′) Ameboid macrophages at hypodermis. (A″) Dendritic macrophages at epidermis. Yellow dotted line denotes apical margin of epidermis. White dotted line denotes hypodermal layer. Epidermis comprises both periderm and basal layer (see Figure S1).
(B) Significantly lower mpeg1 expression in ameboid population compared to the dendritic population; n = 28 dendritic, n = 31 ameboid cells.
(C) Ameboid macrophages are localized more basally than dendritic and reach hypodermis (arrow); n = 63 dendritic, n = 122 ameboid cells.
(D) Migration speed of dendritic and ameboid macrophages; n = 12 dendritic, n = 13 ameboid cells.
(E) Airinemes are pulled by ameboid macrophages (arrowheads). Still images from time-lapse movie.
(F) Percentages of airineme-pulling macrophage subpopulations. Statistical significances were assessed by Student t test. Scale bars, 20 mm. Bars display mean, and error bars display SEM.
