
FIG 2.
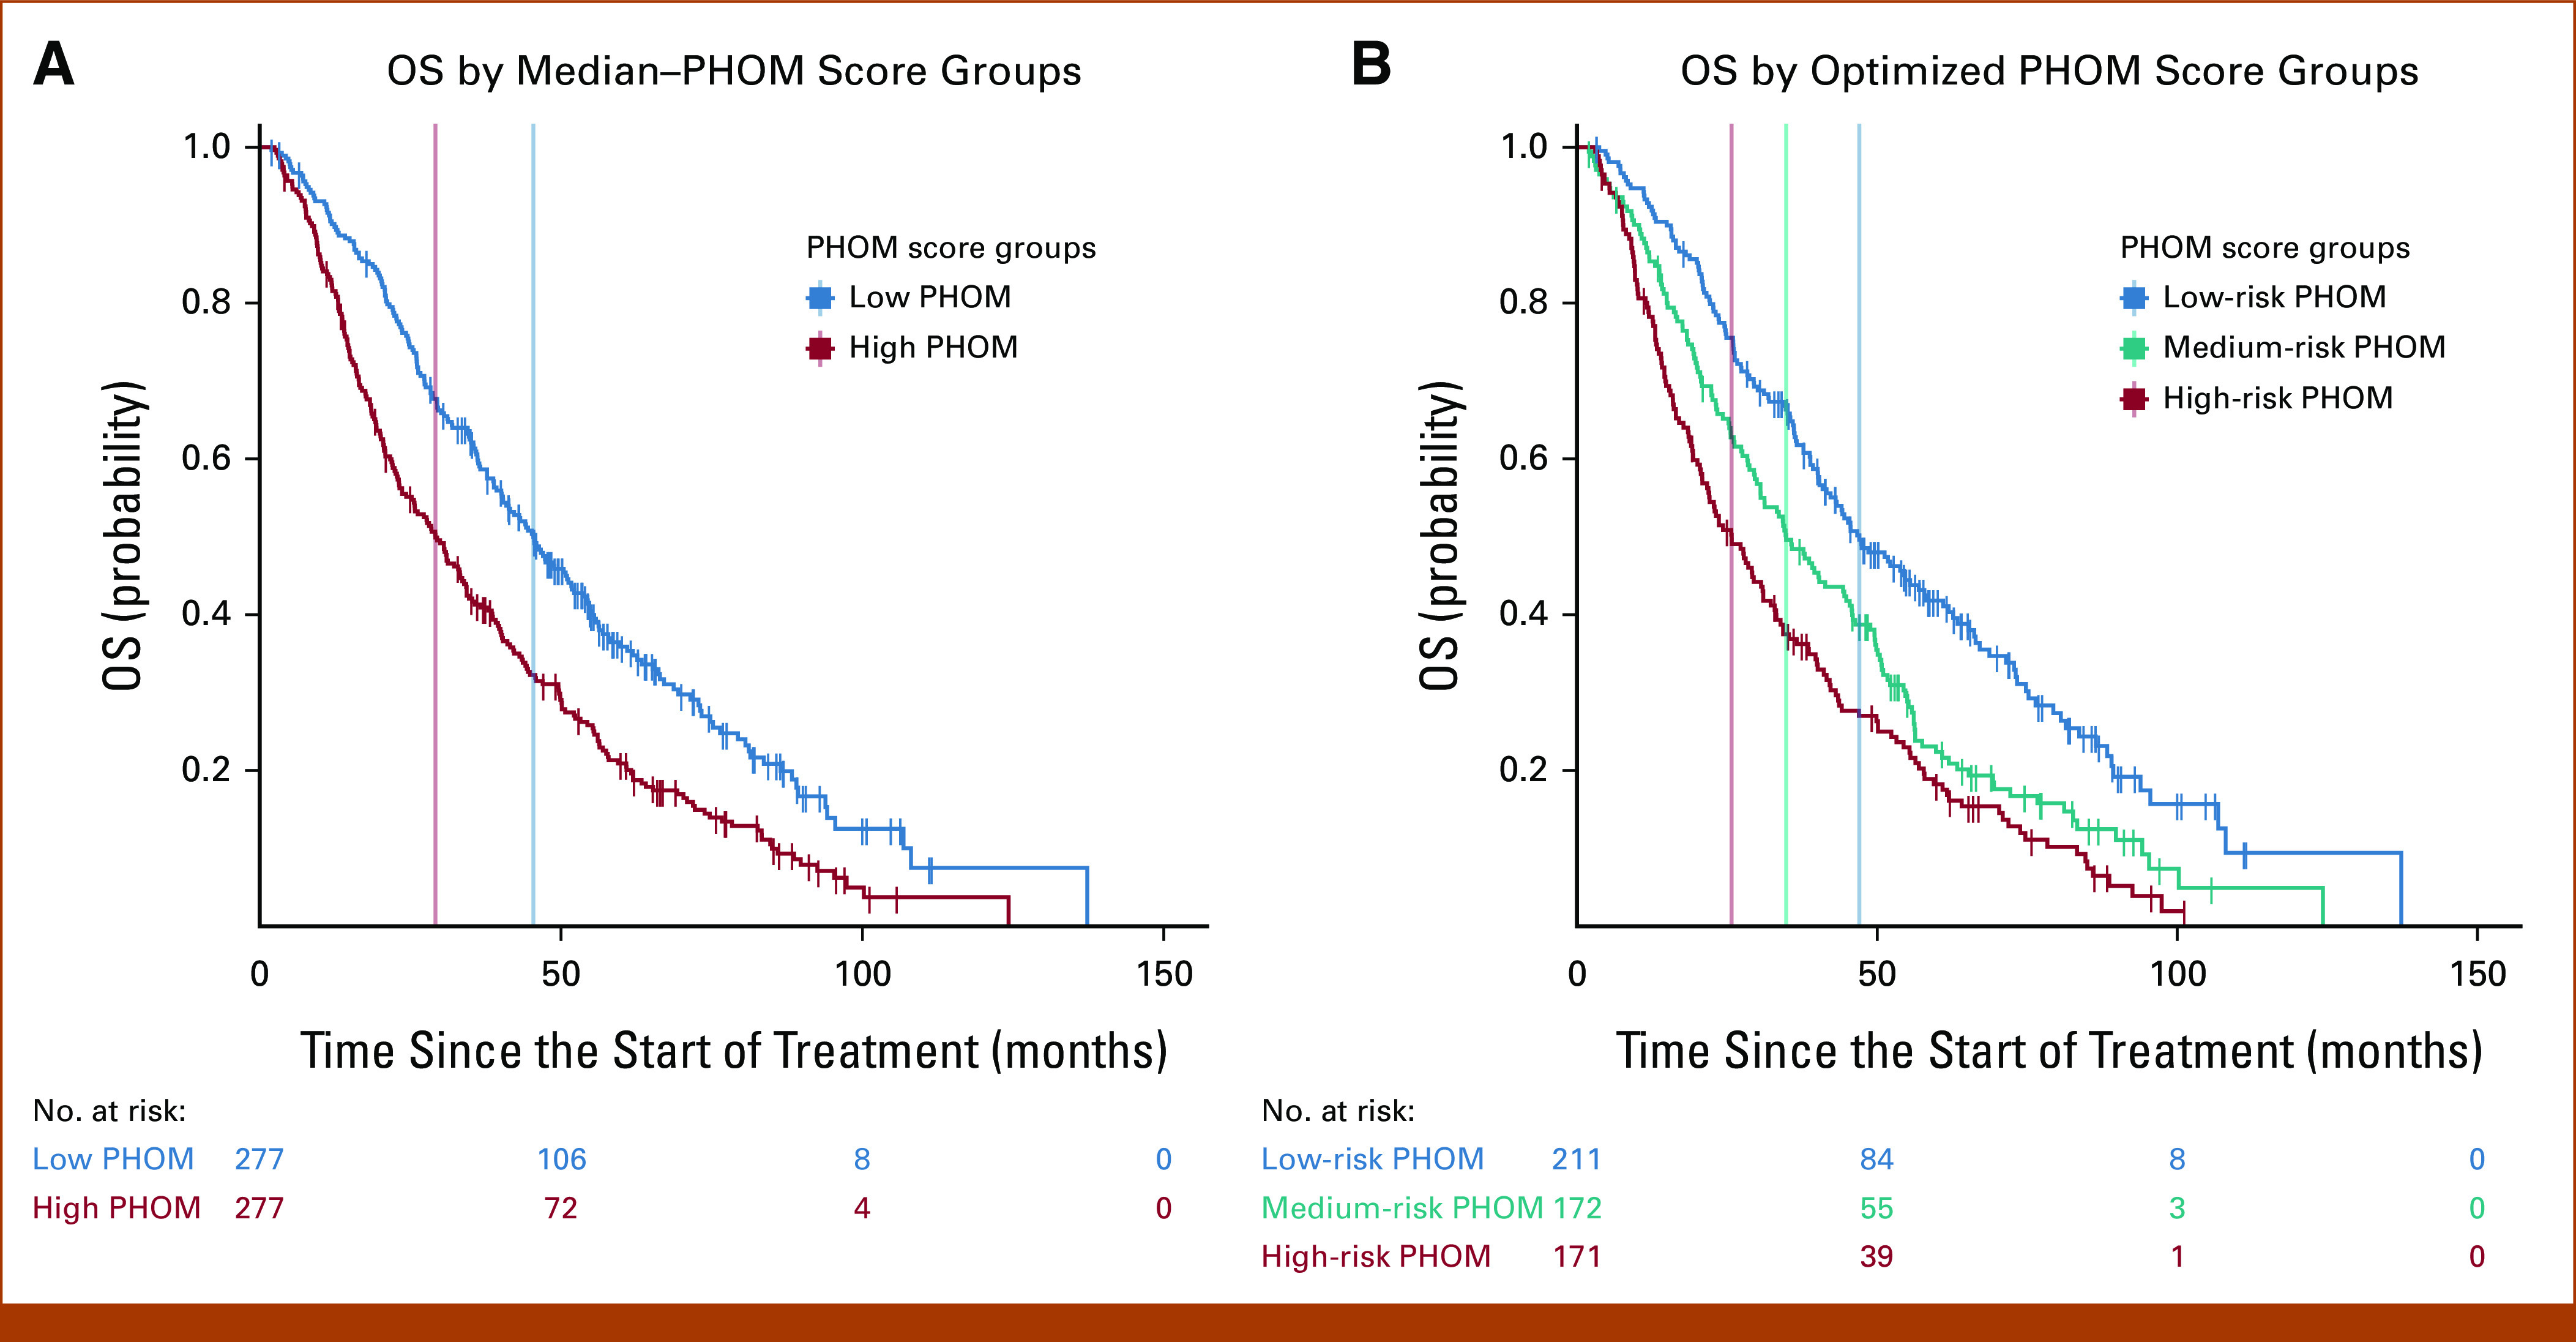
Kaplan-Meier OS by PHOM score. Stratifying the cohort by median PHOM score groups and optimized cutoffs produced well-demarcated survival curves. (A) The median survival for the high-PHOM group was 29.2 months (95% CI, 23.6 to 34.3). The median survival for the low-PHOM group was significantly higher at 45.4 months (95% CI, 40.1 to 51.8; P < .001). (B) The median survival for the high-PHOM risk group was 25.7 months (95% CI, 20.9 to 31.0). This was significantly less than that for both the medium- (P = .020) and low-risk PHOM score groups (P < .001). The median survival for the medium-risk group was 34.8 months (95% CI, 29.9 to 44.9). This was significantly less than that of the low-risk PHOM score group (P < .001). The median survival for the low-risk group was 47.0 months (95% CI, 40.9 to 58.1). However, it is important to note that these P values are somewhat moot since the tertiles were calculated to maximize the chi-square value of the KM curve. KM, Kaplan-Meier; OS, overall survival; PHOM, persistent homology.