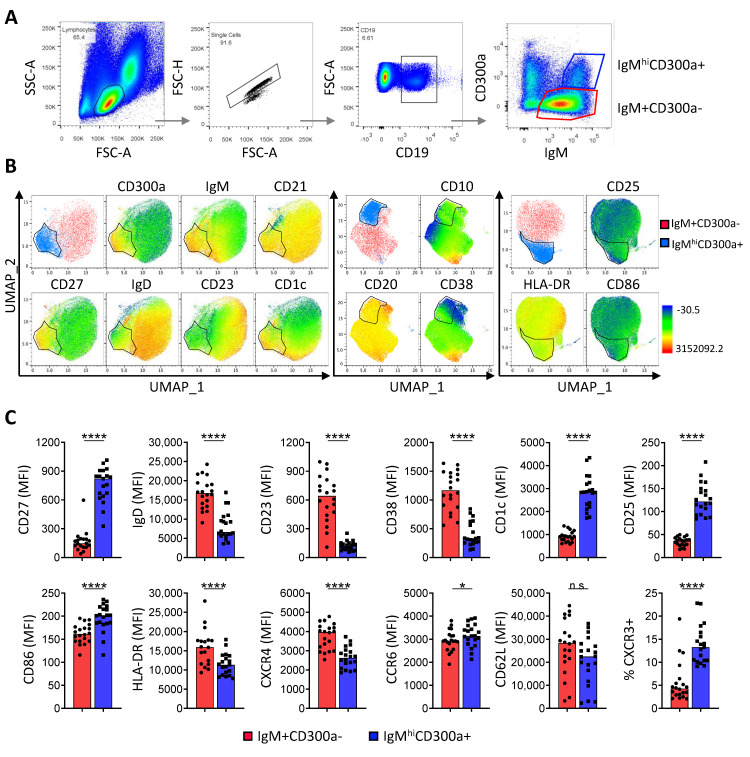
Figure 1.
IgMhiCD300a+ B cell phenotype from peripheral blood of healthy donors. (A) Pseudocolor plots showing the gating strategy to distinguish IgM+CD300a− (red) and IgMhiCD300a+ (blue) B cell subsets from peripheral CD19+ B cells from healthy donors. (B) Three UMAP projections defining IgM+CD300a− (red) and IgMhiCD300a+ (blue) B cell subsets and showing the relative expression of CD300a, IgM, CD10, CD20, CD21, CD27, IgD, CD23, CD38, CD1c, CD10, CD20, CD38, CD25, CD86, and HLA-DR. (C) Dot-bar graphs showing the median fluorescence intensity (MFI) of CD27, IgD, CD23, CD38, CD1c, CD25, CD86, HLA-DR, CXCR4, CCR6, and CD62L and the percentage of CXCR3+ cells in IgM+CD300a− (red) and in IgMhiCD300a+ (blue) B cell subsets. Data are presented as the mean of 20 individual donors. Statistical significance was determined using a t-test or Wilcoxon matched-pairs signed rank test. * p < 0.05, **** p < 0.0001, ns: not significant.

