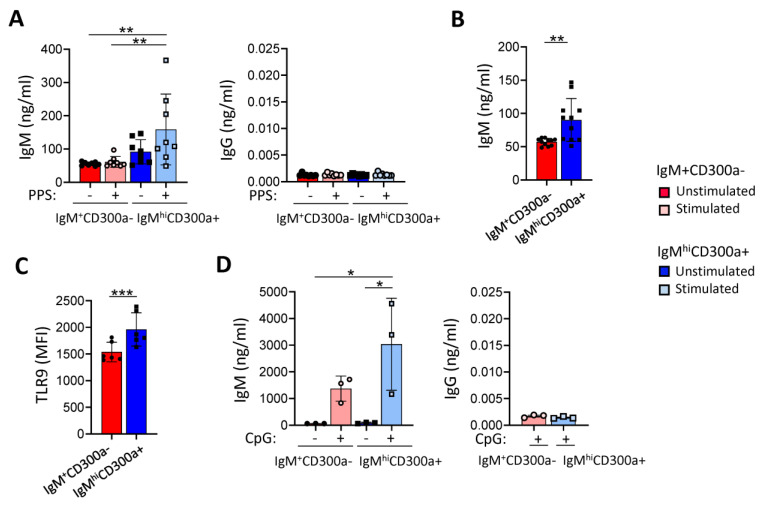
Figure 3.
Higher production of IgM in response to PPS and CpG class B (ODN 2006) in IgMhiCD300a+ B cells than in IgM+CD300a− B cells. (A) Dot-bar graphs showing the concentration (ng/mL) of IgM (left panel) and IgG (right panel) produced by sorted IgM+CD300a− (red) and IgMhiCD300a+ (blue) B cells after 7 days in the absence (−) or presence (+) of pneumococcal polysaccharides (PPS) (strains 3, 14, 17F). Each dot represents a donor (n = 8). (B) Dot-bar graph showing the concentration (ng/mL) of IgM produced by unstimulated sorted IgM+CD300a− (red) and IgMhiCD300a+ (blue) B cells. Each dot represents a donor (n = 11). (C) Dot-bar graph showing the MFI of TLR9 in IgM+CD300a− (red) and IgMhiCD300a+ (blue) B cells. Each dot represents a donor (n = 6). (D) Dot-bar graphs showing the concentration (ng/mL) of IgM (left panel) and IgG (right panel) produced by sorted IgM+CD300a− (red) and IgMhiCD300a+ (blue) B cells after 7 days in the absence (−) and presence (+) of CpG class B (ODN 2006) (3μM). Each dot represents a donor (n = 3). Data are presented as the mean ± SD. Statistical significance for multiple group comparisons was determined using one-way ANOVA and for single-group comparisons was determined using paired t-test. * p < 0.05, ** p < 0.01, *** p < 0.001.

