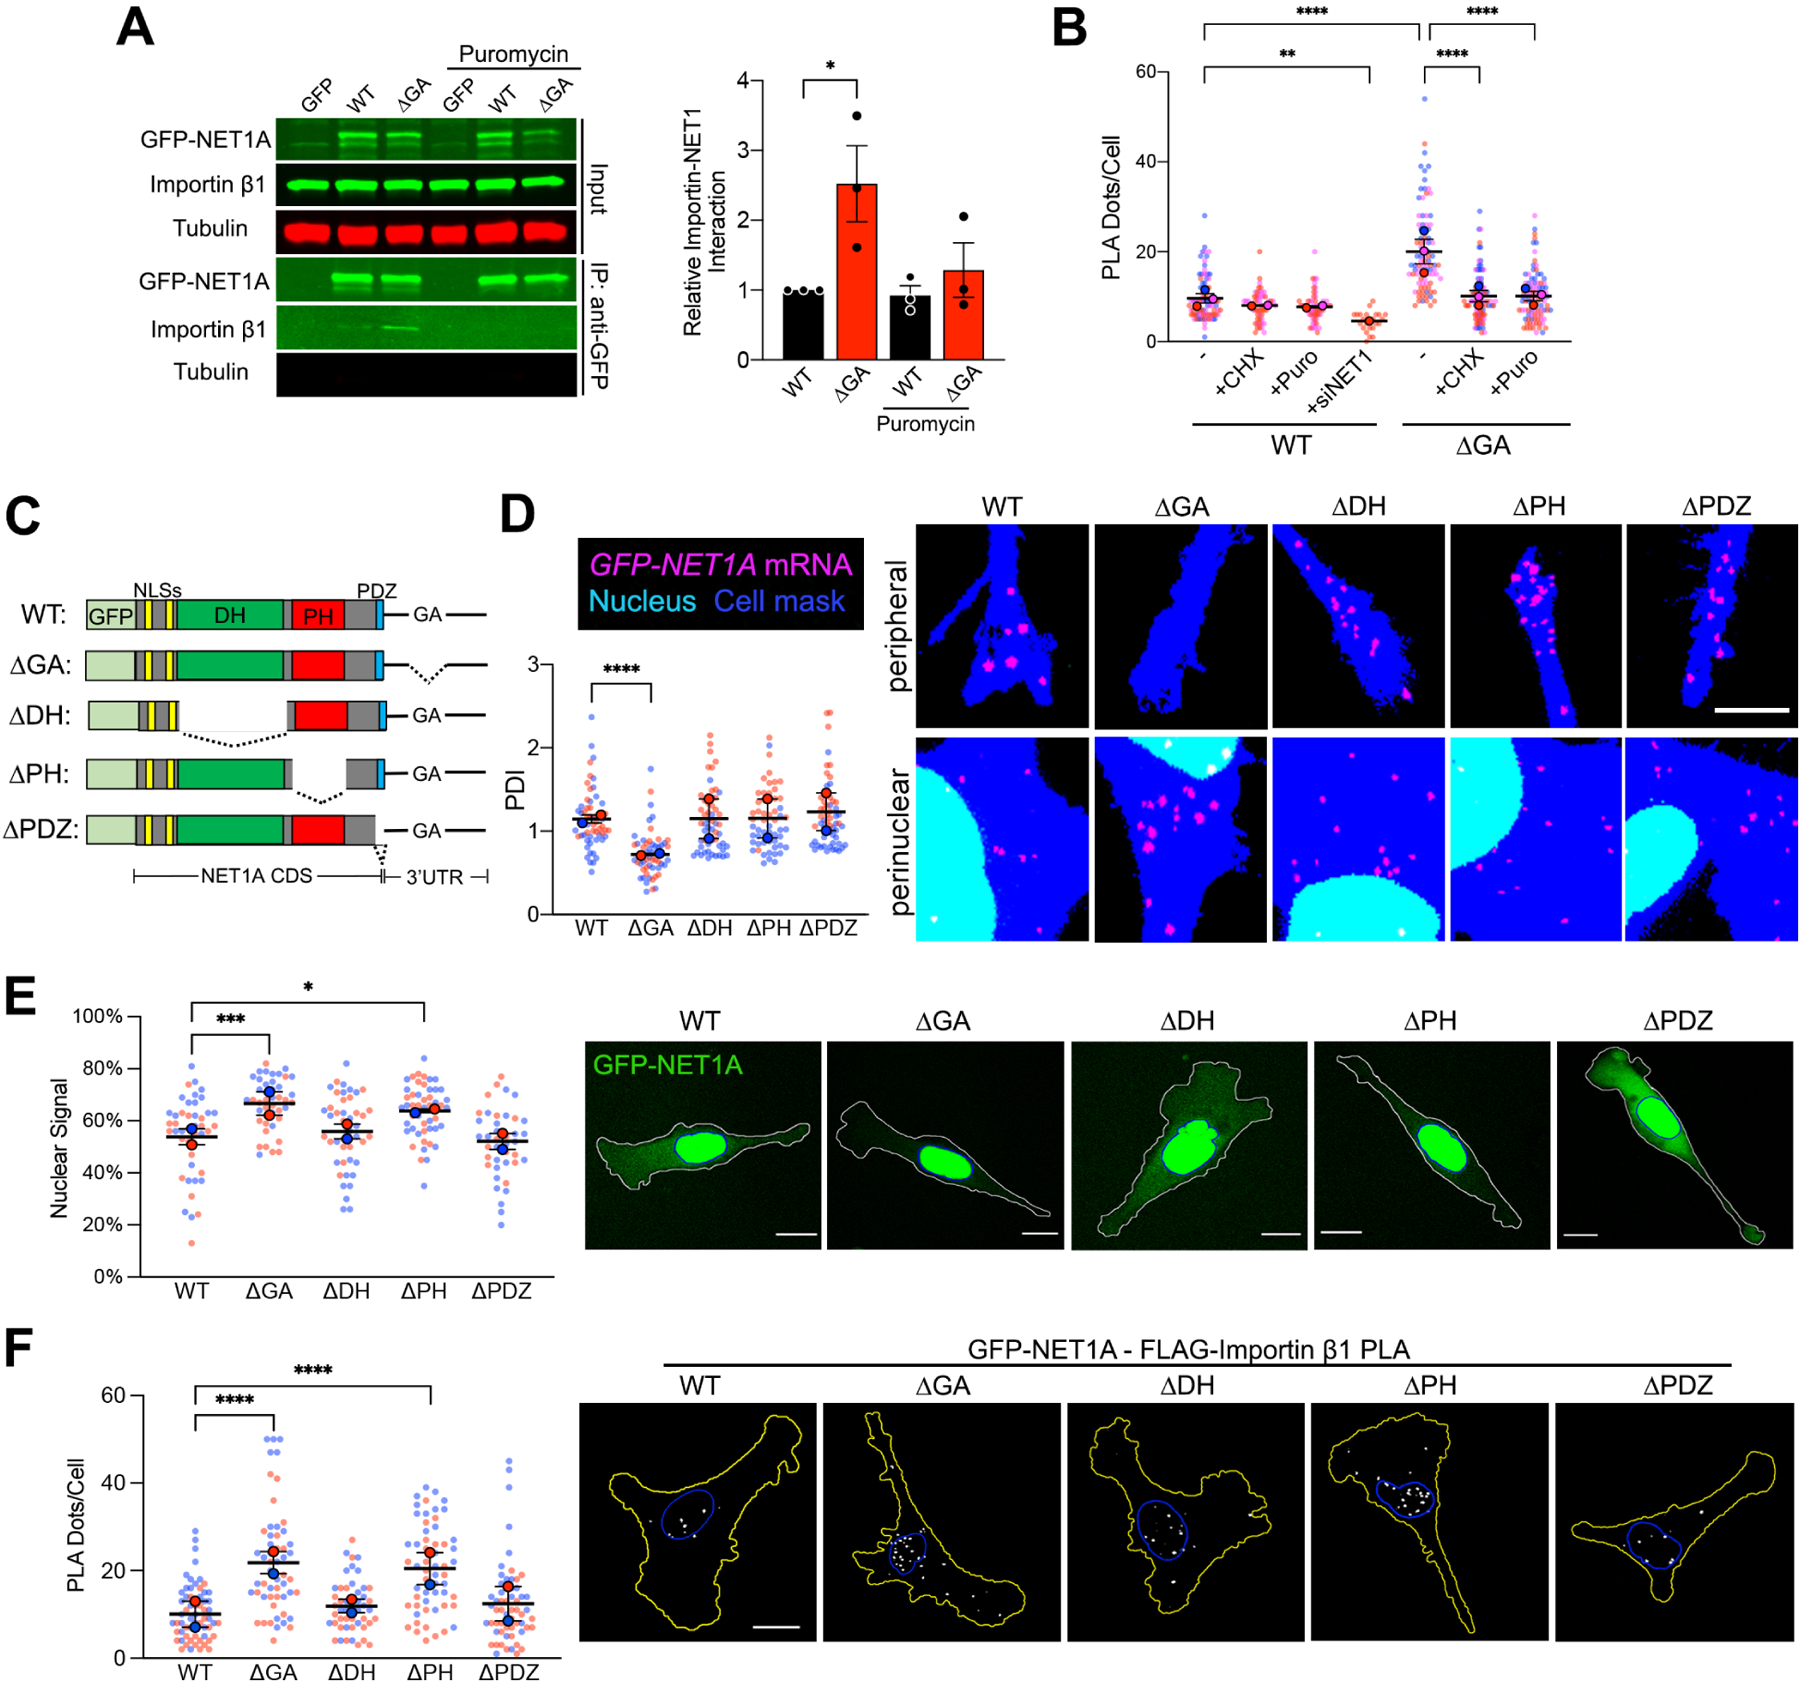
Figure 3: The NLS and PH domains competitively determine nuclear import of newly-synthesized NET1A protein.

(A) Importin β1 binding to GFP or GFP-NET1A from co-immunoprecipitation experiments of the indicated MDA-MB-231 cell lines with 20min puromycin treatment. Quantifications are shown relative to the WT untreated sample. n=3. (B) Quantification of in situ interaction between GFP-NET1A and FLAG-importin β1, by PLA of the indicated cell lines, with 20min cycloheximide (CHX) or puromycin (Puro) treatment, or NET1 knockdown (siNET1). n=55–98 in 2–3 independent experiments. For siNET1 n=25. (C) Schematic of the GFP-NET1A constructs used for generation of stably expressing MDA-MB-231 cell lines. Dotted lines indicate deleted regions. (D) FISH images and corresponding PDI values of GFP-NET1A mRNA distribution in the indicated stable cell lines. Zoomed in perinuclear and peripheral regions are shown. n=55–58 cells from 2 independent experiments. (E) Live GFP fluorescence imaging of the indicated cell lines and quantification of the percent GFP-NET1A signal within the nucleus. Blue outline: nuclear boundary; white outline: cell boundary. n=40–50 in 2 independent experiments. (F) In situ detection of interaction between GFP-NET1A and FLAG-importin β1, by PLA in the indicated cell lines. White dots: PLA signal; blue outline: nuclear boundary; yellow outline: cell boundary. n=49–59 in 2 independent experiments. In superplots, data points from individual replicates are color coded, and large, outlined color dots indicate the mean of each replicate. Error bars: SEM. p-values: *<0.05, **<0.01, ***<0.001, ****<0.0001 by unpaired t-test (A) or one-way ANOVA (B, D, E, F). Scale bars: 4μm (D); 15μm (E, F).
