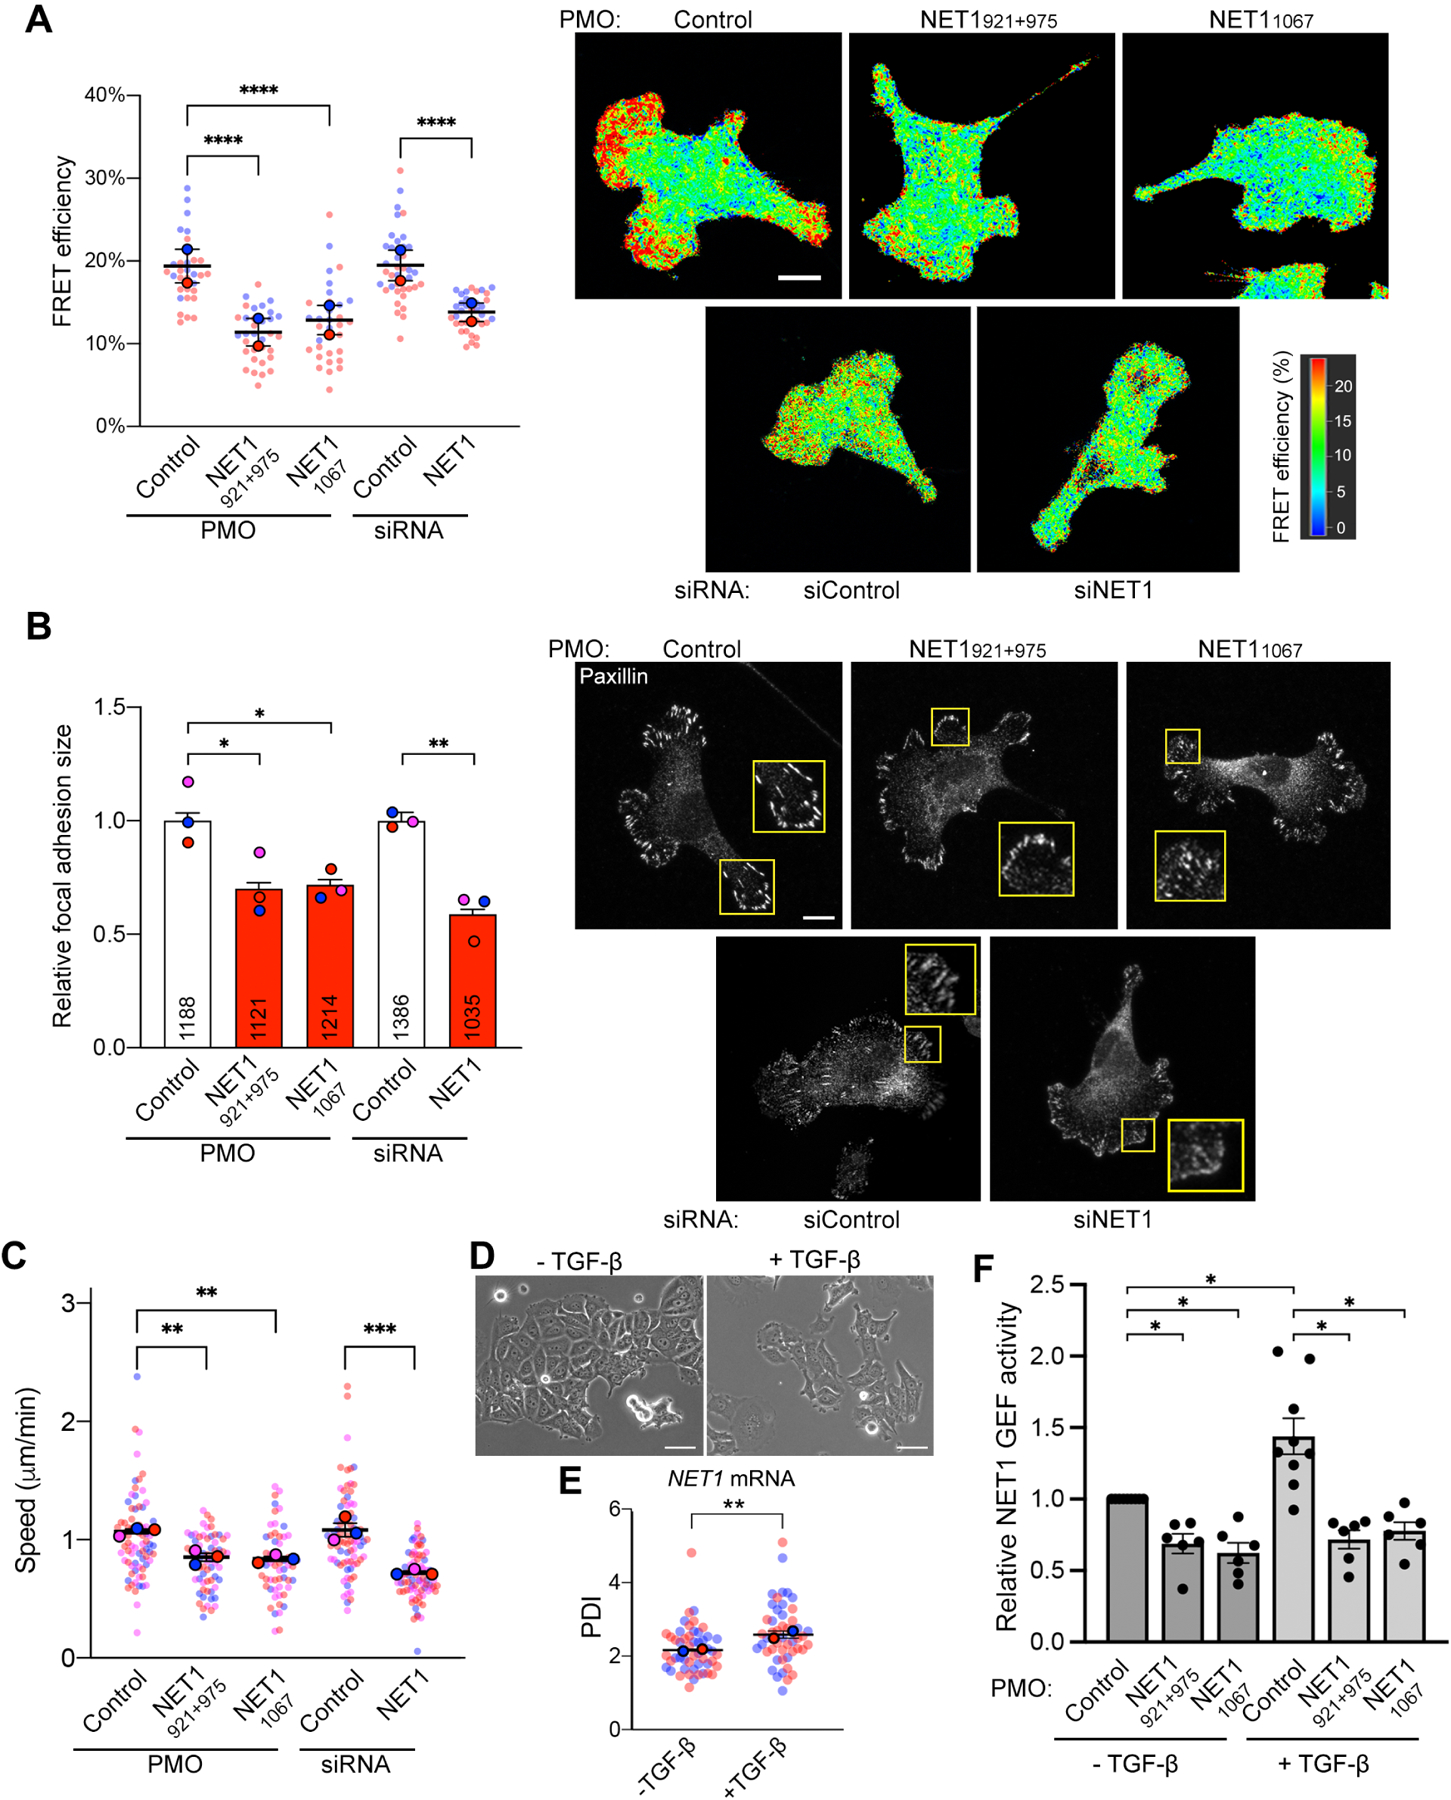
Figure 6. NET1 mRNA location robustly affects NET1 function in cell migration, and controls TGFβ-induced NET1 activity.

(A) FLIM imaging of a RhoA activity biosensor in MDA-MB-231 cells treated with the indicated PMOs or siRNAs. Graph shows FRET efficiency in protrusive regions. N=32–38 cells from 2 independent experiments. (B) Measurement of focal adhesion size based on paxillin immunofluorescence staining of cells treated with the indicated PMOs or siRNAs. Numbers within each bar indicate the number of focal adhesions measured in 3 independent experiments. (C) Average migration speeds measured by time lapse imaging of mCherry-NLS expressing cells treated with the indicated PMOs or siRNAs. N=57–78 cells from 3 independent experiments. (D) Phase contrast images of MCF7 cells with or without TGF-β treatment. (E) PDI of NET1 mRNA in MCF7 cells with and without TGF-β. n=50 cells from two independent experiments. (F) Relative NET1 binding to nucleotide-free RhoA (RhoA G17A), as a measure of GEF activity, in MCF7 cells with and without TGF-β, and treated with the indicated PMOs. n=3. In superplots, data points from individual replicates are color coded, and large, outlined color dots indicate the mean of each replicate. Error bars: SEM. p-values: *<0.05, **<0.01, ***<0.001, ****<0.0001 by one-way ANOVA. Scale bars: 15μm (A, B); 50μm (D).
